第2章記述統計
Exercises 42–47練習問題 42–47
Use the following information to answer the next six exercises. Sixty-five randomly selected car salespersons were asked the number of cars they generally sell in one week. Fourteen people answered that they generally sell three cars; nineteen generally sell four cars; twelve generally sell five cars; nine generally sell six cars; eleven generally sell seven cars.
次の情報で、続く6問に答えよ。無作為に選んだ自動車販売員65人に、通常1週間で何台売るか尋ねた。14人は3台、19人は4台、12人は5台、9人は6台、11人は7台と答えた。
Exercise 42問題 42
First quartile = _______
第1四分位数=_______
Exercise 43問題 43
Second quartile = median = 50th percentile = _______
第2四分位数=中央値=第50パーセンタイル=_______
Solution解き方
4
Exercise 44問題 44
Third quartile = _______
第3四分位数=_______
Exercise 45問題 45
Interquartile range (IQR) = _____ – _____ = _____
四分位範囲(IQR)=_____−_____=_____
Solution解き方
6 – 4 = 2
Exercise 46問題 46
10th percentile = _______
第10パーセンタイル=_______
Exercise 47問題 47
70th percentile = _______
第70パーセンタイル=_______
Solution解き方
6
Homework宿題
Exercises 48–51練習問題 48–51
Exercise 48問題 48
The median age for Black people in the U.S. is 30.9 years; for U.S. White people it is 42.3 years.
米国の黒人の年齢中央値は30.9歳、白人は42.3歳である。
- Based upon this information, give two reasons why the median age for Black people could be lower than the median age for White people.この情報に基づき、黒人の年齢中央値が白人より低くなりうる理由を2つ挙げよ。
- Does the lower median age for Black people necessarily mean that Black people die younger than White people? Why or why not?黒人の年齢中央値が低いことは、必ず黒人が白人より若く亡くなることを意味するか。理由を説明せよ。
- How might it be possible for Black people and White people to die at approximately the same age, but for the median age for White people to be higher?黒人と白人がほぼ同じ年齢で亡くなっても、白人の年齢中央値が高くなることは、どうすれば起こりうるか。
Exercise 49問題 49
Six hundred adult Americans were asked by telephone poll, "What do you think constitutes a middle-class income?" The results are in Table 2.54. Also, include left endpoint, but not the right endpoint.
米国の成人600人に電話調査で、「中流階級の所得とは、いくらくらいだと思うか」と尋ねた。結果を表2.54に示す。区間は左端を含み、右端を含めない。
Salary ($) 給与(ドル) |
Relative Frequency 相対度数 |
|---|---|
< 20,000 |
0.02 |
20,000–25,000 |
0.09 |
25,000–30,000 |
0.19 |
30,000–40,000 |
0.26 |
40,000–50,000 |
0.18 |
50,000–75,000 |
0.17 |
75,000–99,999 |
0.02 |
100,000+ |
0.01 |
- What percentage of the survey answered "not sure"?「分からない」と答えた人は何%か。
- What percentage think that middle-class is from $25,000 to $50,000?中流階級は25,000~50,000ドルだと考える人は何%か。
- Construct a histogram of the data.データのヒストグラムを作成せよ。
- Should all bars have the same width, based on the data? Why or why not?データから考えて、棒の幅はすべて同じにすべきか。理由を述べよ。
- How should the <20,000 and the 100,000+ intervals be handled? Why?20,000未満と100,000以上の区間はどう扱うべきか。理由も述べよ。
- Find the 40th and 80th percentiles第40パーセンタイルと第80パーセンタイルを求めよ。
- Construct a bar graph of the dataデータの棒グラフを作成せよ。
Solution解き方
- 1 – (0.02+0.09+0.19+0.26+0.18+0.17+0.02+0.01) = 0.06
- 0.19+0.26+0.18 = 0.63
- Answers may vary.解答はさまざまである。
- 40th percentile will fall between 30,000 and 40,000第40パーセンタイルは30,000~40,000の間に入る。80th percentile will fall between 50,000 and 75,000第80パーセンタイルは50,000~75,000の間に入る。
- Answers may vary.解答はさまざまである。
Exercise 50問題 50
Given the following box plot:
次の箱ひげ図について答えよ。

Figure 2.25図 2.25
- which quarter has the smallest spread of data? What is that spread?4分割された区間のうち、散らばりが最も小さいのはどこか。その幅はいくつか。
- which quarter has the largest spread of data? What is that spread?4分割された区間のうち、散らばりが最も大きいのはどこか。その幅はいくつか。
- find the interquartile range (IQR).四分位範囲(IQR)を求めよ。
- are there more data in the interval 5–10 or in the interval 10–13? How do you know this?区間5~10と10~13では、どちらのデータが多いか。どうして分かるか。
- which interval has the fewest data in it? How do you know this?データが最も少ない区間はどれか。どうして分かるか。
- 0–2
- 2–4
- 10–12
- 12–13
- need more informationさらに情報が必要
Exercise 51問題 51
The following box plot shows the U.S. population for a certain year.
次の箱ひげ図は、ある年の米国の人口を示す。
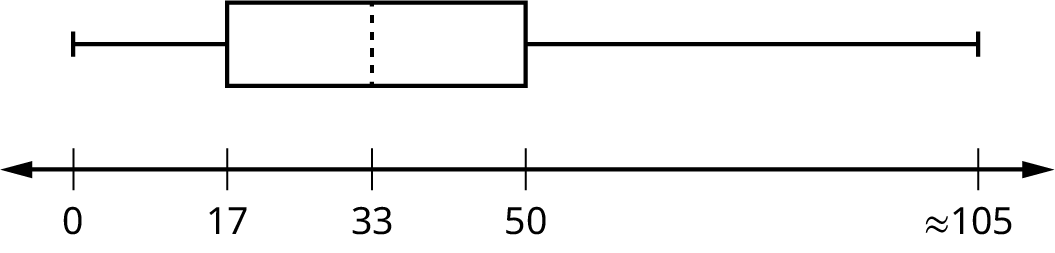


Figure 2.26図 2.26
- Are there fewer or more children (age 17 and under) than senior citizens (age 65 and over)? How do you know?子ども(17歳以下)は高齢者(65歳以上)より少ないか、多いか。どうして分かるか。
- 12.6% are age 65 and over. Approximately what percentage of the population are working age adults (above age 17 to age 65)?65歳以上は12.6%である。労働年齢の成人(17歳超から65歳まで)は、人口のおよそ何%か。
Solution解き方
- more children; the left whisker shows that 25% of the population are children 17 and younger. The right whisker shows that 25% of the population are adults 50 and older, so adults 65 and over represent less than 25%.子どもの方が多い。左のひげは、人口の25%が17歳以下の子どもであることを示す。右のひげは、25%が50歳以上の成人であることを示すため、65歳以上は25%未満になる。
- 62.4%
Interquartile Range
四分位範囲
or IQR, is the range of the middle 50 percent of the data values; the IQR is found by subtracting the first quartile from the third quartile.
略してIQR。データの中央50%の範囲であり、第3四分位数から第1四分位数を引いて求める。
Outlier
外れ値
an observation that does not fit the rest of the data
ほかのデータになじまない観測値。
Percentile
パーセンタイル
a number that divides ordered data into hundredths; percentiles may or may not be part of the data. The median of the data is the second quartile and the 50th percentile. The first and third quartiles are the 25th and the 75th percentiles, respectively.
順序に並べたデータを100等分する数値。データ中に存在する場合もしない場合もある。中央値は第2四分位数であり、第50パーセンタイルでもある。第1、第3四分位数は、それぞれ第25、第75パーセンタイルである。
Quartiles
四分位数
the numbers that separate the data into quarters; quartiles may or may not be part of the data. The second quartile is the median of the data.
データを4分割する数値。データ中に存在する場合もしない場合もある。第2四分位数は中央値である。