第2章記述統計
2.6 Skewness and the Mean, Median, and Mode2.6 歪みと平均値・中央値・最頻値
Consider the following data set.
4; 5; 6; 6; 6; 7; 7; 7; 7; 7; 7; 8; 8; 8; 9; 10
4; 5; 6; 6; 6; 7; 7; 7; 7; 7; 7; 8; 8; 8; 9; 10
次のデータセットを考えよう。4; 5; 6; 6; 6; 7; 7; 7; 7; 7; 7; 8; 8; 8; 9; 10
This data set can be represented by following histogram. Each interval has width one, and each value is located in the middle of an interval.
このデータセットを、次のヒストグラムで表せる。各区間の幅は1で、各値は区間の中央に位置する。
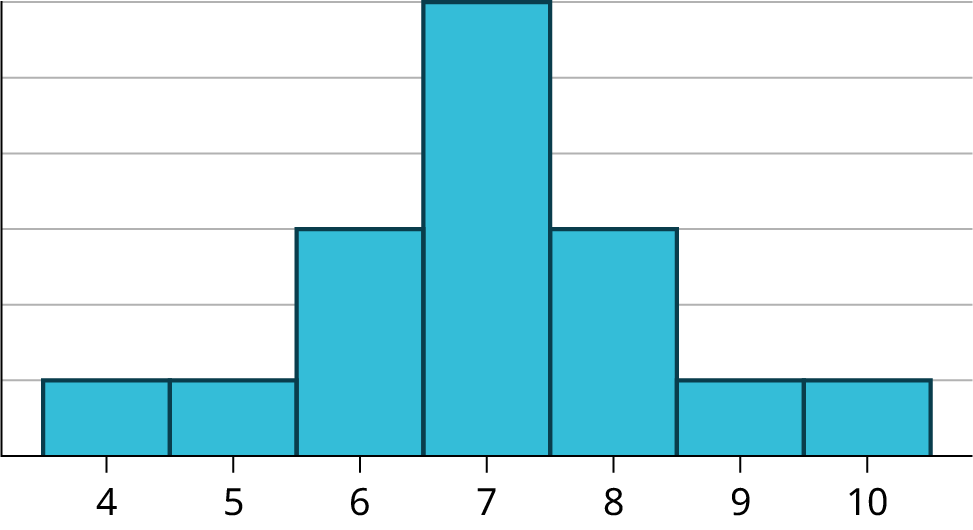
Figure 2.39図 2.39
The histogram (shown in Figure 2.39) displays a symmetrical distribution of data. A distribution is symmetrical if a vertical line can be drawn at some point in the histogram such that the shape to the left and the right of the vertical line are mirror images of each other. The mean, the median, and the mode are each seven for these data. In a perfectly symmetrical distribution, the mean and the median are the same. This example has one mode (unimodal), and the mode is the same as the mean and median. In a symmetrical distribution that has two modes (bimodal), the two modes would be different from the mean and median.
英語のヒント
図2.39のヒストグラムは、対称なデータ分布を示す。ある点に縦線を引いたとき、その左右が鏡に映した形になる分布を対称という。このデータでは、平均値、中央値、最頻値はすべて7である。完全に対称な分布では、平均値と中央値は同じである。この例は最頻値を1つ持つ単峰性の分布で、最頻値も平均値や中央値と一致する。最頻値が2つある二峰性の対称分布では、2つの最頻値は平均値や中央値とは異なる。
The histogram for the data:
次のデータのヒストグラムは、
- 4
- 5
- 6
- 6
- 6
- 7
- 7
- 7
- 7
- 8 (shown in Figure 2.40)8(図2.40)
is not symmetrical. The right-hand side seems "chopped off" compared to the left side. A distribution of this type is called skewed to the left because it is pulled out to the left.
対称ではない。左側に比べて、右側が「切り落とされた」ように見える。左側へ引き延ばされるため、このような分布は左に歪んでいるという。
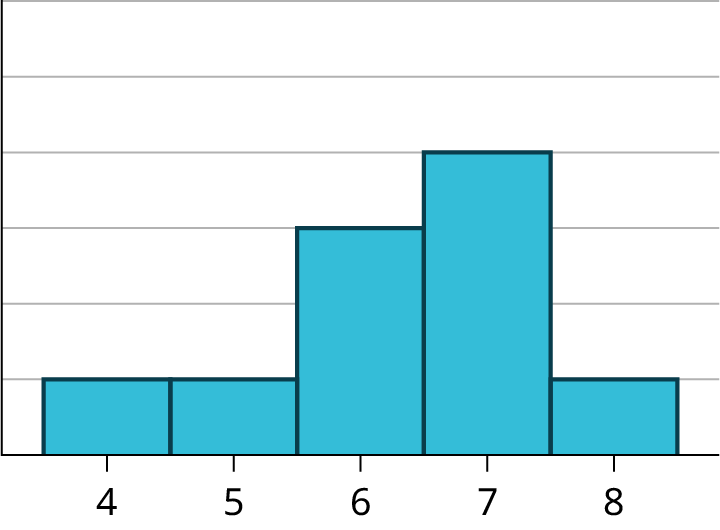
Figure 2.40図 2.40
The mean is 6.3, the median is 6.5, and the mode is seven. Notice that the mean is less than the median, and they are both less than the mode. The mean and the median both reflect the skewing, but the mean reflects it more so.
平均値は6.3、中央値は6.5、最頻値は7である。平均値は中央値より小さく、両方とも最頻値より小さい。平均値も中央値も歪みを反映するが、平均値の方が強く反映する。
The histogram for the data:
次のデータのヒストグラムも、
- 6
- 7
- 7
- 7
- 7
- 8
- 8
- 8
- 9
- 10 Figure 2.4110(図2.41)
, is also not symmetrical. It is skewed to the right.
対称ではない。右に歪んでいる。
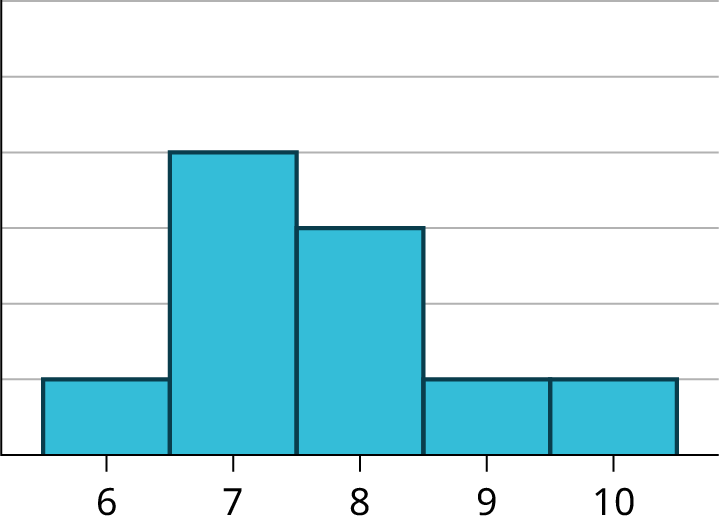
Figure 2.41図 2.41
The mean is 7.7, the median is 7.5, and the mode is seven. Of the three statistics, the mean is the largest, while the mode is the smallest. Again, the mean reflects the skewing the most.
平均値は7.7、中央値は7.5、最頻値は7である。3つの統計量のうち、平均値が最大、最頻値が最小である。ここでも、歪みを最も強く反映するのは平均値である。
The mean is affected by outliers that do not influence the median. Therefore, when the distribution of data is skewed to the left, the mean is often less than the median. When the distribution is skewed to the right, the mean is often greater than the median. In symmetric distributions, we expect the mean and median to be approximately equal in value. This is an important connection between the shape of the distribution and the relationship of the mean and median. It is not, however, true for every data set. The most common exceptions occur in sets of discrete data.
英語のヒント
平均値は、中央値に影響しない外れ値にも影響される。そのため、分布が左に歪むと平均値は中央値より小さくなることが多く、右に歪むと大きくなることが多い。対称な分布では、両者はほぼ等しいと考えられる。これは、分布の形と、平均値・中央値の関係を結ぶ重要なつながりである。しかし、すべてのデータセットで成立するわけではない。例外が特によく見られるのは、離散データである。
Skewness and symmetry become important when we discuss probability distributions in later chapters.
歪みと対称性は、後の章で確率分布を扱うときに重要になる。
Example 2.31例題 2.31
Statistics are used to compare and sometimes identify authors. The following lists shows a simple random sample that compares the letter counts for three authors.
統計は、著者の比較や、場合によっては特定にも使われる。次の一覧は、3人の著者の文字数を比較する単純無作為標本である。
Terry: 7; 9; 3; 3; 3; 4; 1; 3; 2; 2
テリー:7; 9; 3; 3; 3; 4; 1; 3; 2; 2
Davis: 3; 3; 3; 4; 1; 4; 3; 2; 3; 1
デイビス:3; 3; 3; 4; 1; 4; 3; 2; 3; 1
Maris: 2; 3; 4; 4; 4; 6; 6; 6; 8; 3
マリス:2; 3; 4; 4; 4; 6; 6; 6; 8; 3
- Make a dot plot for the three authors and compare the shapes.3人のドットプロットを作成し、形を比較せよ。
- Calculate the mean for each.それぞれの平均値を計算せよ。
- Calculate the median for each.それぞれの中央値を計算せよ。
- Describe any pattern you notice between the shape and the measures of center.形と中心の指標の間に、どのようなパターンが見られるか述べよ。
Solution解き方
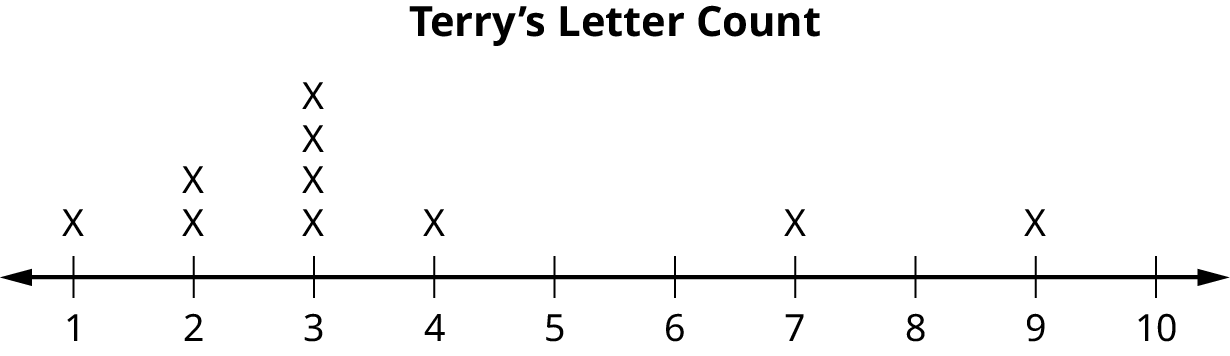
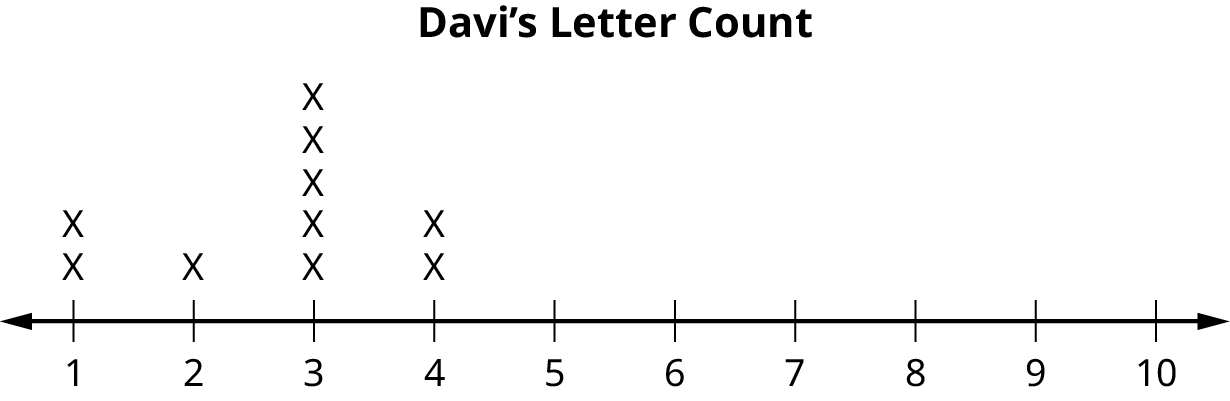
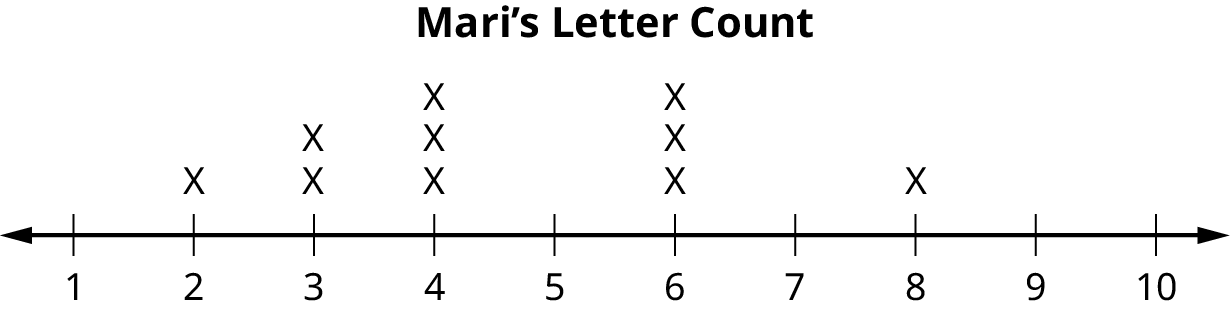
- Figure 2.42図 2.42Terry’s distribution has a right (positive) skew.テリーの分布は右(正)に歪んでいる。Figure 2.43図 2.43Davis’ distribution has a left (negative) skewデイビスの分布は左(負)に歪んでいる。Figure 2.44図 2.44Maris’ distribution is symmetrically shaped.マリスの分布は対称な形である。
- Terry’s mean is 3.7, Davis’ mean is 2.7, Maris’ mean is 4.6.平均値は、テリーが3.7、デイビスが2.7、マリスが4.6である。
- Terry’s median is three, Davis’ median is three. Maris’ median is four.中央値は、テリーが3、デイビスが3、マリスが4である。
- It appears that the median is always closest to the high point (the mode), while the mean tends to be farther out on the tail. In a symmetrical distribution, the mean and the median are both centrally located close to the high point of the distribution.中央値は常に山の頂点(最頻値)に最も近く、平均値は裾側に離れる傾向があるように見える。対称な分布では、平均値も中央値も、分布の頂点に近い中央に位置する。