第2章記述統計
Chapter Review章の復習
Looking at the distribution of data can reveal a lot about the relationship between the mean, the median, and the mode. There are three types of distributions. A left (or negative) skewed distribution has a shape like Figure 2.40. A right (or positive) skewed distribution has a shape like Figure 2.41. A symmetrical distribution looks like Figure 2.39.
Exercises 73–92練習問題 73–92
Use the following information to answer the next three exercises: State whether the data are symmetrical, skewed to the left, or skewed to the right.
次の情報で、続く3問に答えよ。データは対称か、左に歪んでいるか、右に歪んでいるかを述べよ。
Exercise 73問題 73
- 1
- 1
- 1
- 2
- 2
- 2
- 2
- 3
- 3
- 3
- 3
- 3
- 3
- 3
- 3
- 4
- 4
- 4
- 5
- 5
Solution解き方
The data are symmetrical. The median is 3 and the mean is 2.85. They are close, and the mode lies close to the middle of the data, so the data are symmetrical.
データは対称である。中央値は3、平均値は2.85で、両者は近く、最頻値もデータの中央近くにあるため、対称である。
Exercise 74問題 74
- 16
- 17
- 19
- 22
- 22
- 22
- 22
- 22
- 23
Exercise 75問題 75
- 87
- 87
- 87
- 87
- 87
- 88
- 89
- 89
- 90
- 91
Solution解き方
The data are skewed right. The median is 87.5 and the mean is 88.2. Even though they are close, the mode lies to the left of the middle of the data, and there are many more instances of 87 than any other number, so the data are skewed right.
データは右に歪んでいる。中央値87.5と平均値88.2は近いが、最頻値が中央より左にあり、ほかのどの値より87が圧倒的に多いため、右に歪んでいる。
Exercise 76問題 76
When the data are skewed left, what is the typical relationship between the mean and median?
データが左に歪んでいるとき、平均値と中央値には通常どのような関係があるか。
Exercise 77問題 77
When the data are symmetrical, what is the typical relationship between the mean and median?
データが対称なとき、平均値と中央値には通常どのような関係があるか。
Solution解き方
When the data are symmetrical, the mean and median are close or the same.
データが対称なとき、平均値と中央値は近いか、同じである。
Exercise 78問題 78
What word describes a distribution that has two modes?
最頻値を2つ持つ分布を、何と呼ぶか。
Exercise 79問題 79
Describe the shape of this distribution.
この分布の形を説明せよ。
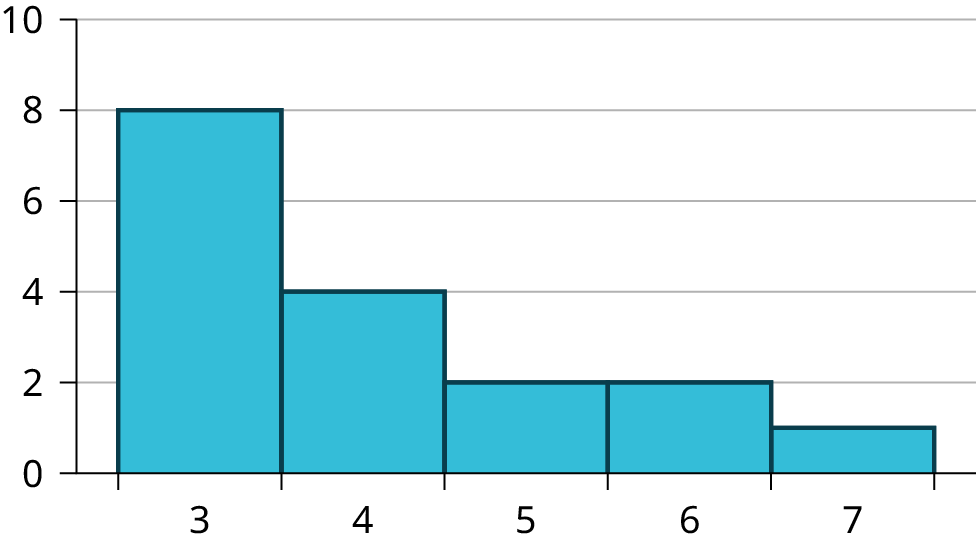
Figure 2.47図 2.47
Solution解き方
The distribution is skewed right because it looks pulled out to the right.
右側へ引き延ばされて見えるので、分布は右に歪んでいる。
Exercise 80問題 80
Exercise 81問題 81
Describe the relationship between the mean and the median of this distribution.
この分布の平均値と中央値の関係を説明せよ。
Figure 2.49図 2.49
Solution解き方
The mean is 4.1 and is slightly greater than the median, which is four.
平均値は4.1で、中央値4よりわずかに大きい。
Exercise 82問題 82
Exercise 83問題 83
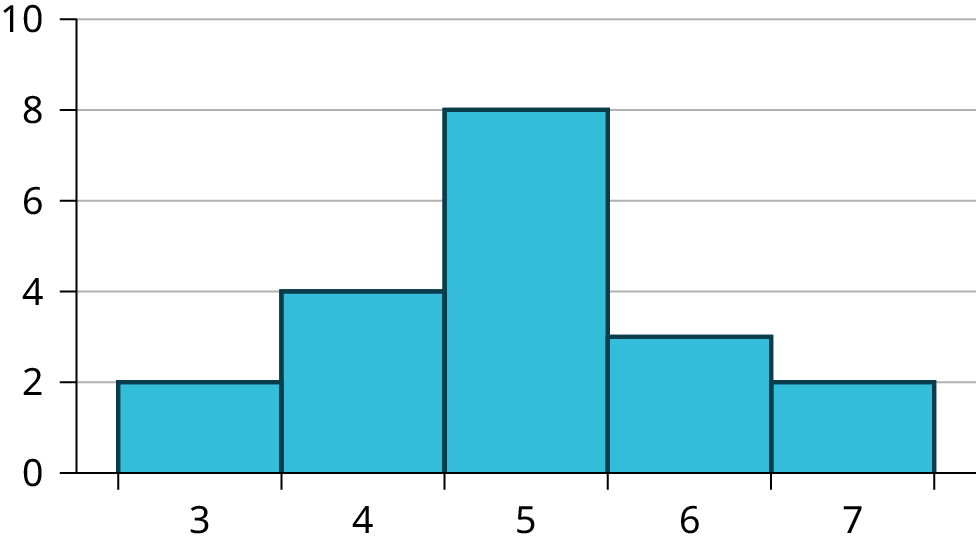
Describe the relationship between the mode and the median of this distribution.
この分布の最頻値と中央値の関係を説明せよ。
Figure 2.51図 2.51
Solution解き方
The mode and the median are the same. In this case, they are both five.
最頻値と中央値は同じであり、この場合はどちらも5である。
Exercise 84問題 84
Exercise 85問題 85
Describe the shape of this distribution.
この分布の形を説明せよ。
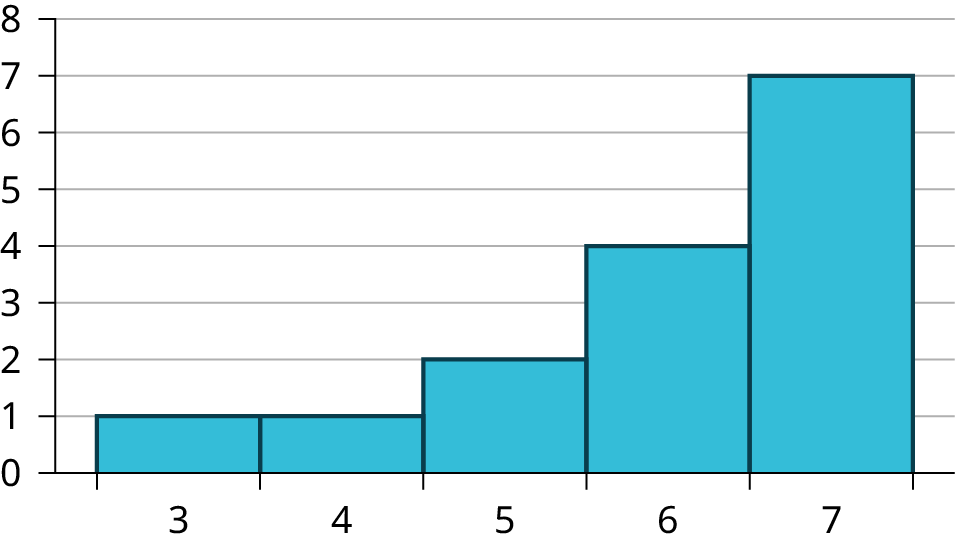


Figure 2.53図 2.53
Solution解き方
The distribution is skewed left because it looks pulled out to the left.
左側へ引き延ばされて見えるので、分布は左に歪んでいる。
Exercise 86問題 86
Exercise 87問題 87
Describe the relationship between the mean and the median of this distribution.
この分布の平均値と中央値の関係を説明せよ。
Figure 2.55図 2.55
Solution解き方
The mean and the median are both six.
平均値と中央値は、どちらも6である。
Exercise 88問題 88
The mean and median for the data are the same.
このデータの平均値と中央値は同じである。
- 3
- 4
- 5
- 5
- 6
- 6
- 6
- 6
- 7
- 7
- 7
- 7
- 7
- 7
- 7
Is the data perfectly symmetrical? Why or why not?
データは完全に対称か。理由を述べよ。
Exercise 89問題 89
Which is the greatest, the mean, the mode, or the median of the data set?
平均値、最頻値、中央値のうち、最大のものはどれか。
- 11
- 11
- 12
- 12
- 12
- 12
- 13
- 15
- 17
- 22
- 22
- 22
Solution解き方
The mode is 12, the median is 12.5, and the mean is 15.1. The mean is the largest.
最頻値は12、中央値は12.5、平均値は15.1である。平均値が最大となる。
Exercise 90問題 90
Which is the least, the mean, the mode, and the median of the data set?
平均値、最頻値、中央値のうち、最小のものはどれか。
- 56
- 56
- 56
- 58
- 59
- 60
- 62
- 64
- 64
- 65
- 67
Exercise 91問題 91
Of the three measures, which tends to reflect skewing the most, the mean, the mode, or the median? Why?
平均値、最頻値、中央値のうち、歪みを最も強く反映しやすい指標はどれか。なぜか。
Solution解き方
The mean tends to reflect skewing the most because it is affected the most by outliers.
外れ値の影響を最も受けるので、平均値が歪みを最も強く反映しやすい。
Exercise 92問題 92
In a perfectly symmetrical distribution, when would the mode be different from the mean and median?
完全に対称な分布で、最頻値が平均値や中央値と異なるのは、どのような場合か。
Homework宿題
Exercises 93練習問題 93
Exercise 93問題 93
The median age of the U.S. population in 1980 was 30.0 years. In 1991, the median age was 33.1 years.
米国人口の年齢中央値は、1980年には30.0歳、1991年には33.1歳だった。
- What does it mean for the median age to rise?年齢中央値が上昇するとは、どういう意味か。
- Give two reasons why the median age could rise.年齢中央値が上昇しうる理由を2つ挙げよ。
- For the median age to rise, is the actual number of children less in 1991 than it was in 1980? Why or why not?年齢中央値が上昇するためには、1991年の子どもの実数が1980年より少なくなっていなければならないか。理由を述べよ。