第2章記述統計
2.4 Box Plots2.4 箱ひげ図
Box plots (also called box-and-whisker plots or box-whisker plots) give a good graphical image of the concentration of the data. They also show how far the extreme values are from most of the data. A box plot is constructed from five values: the minimum value, the first quartile, the median, the third quartile, and the maximum value. We use these values to compare how close other data values are to them.
箱ひげ図(box plot、box-and-whisker plot、box-whisker plot)は、データの集中の仕方をよく示す。また、極端な値が大部分のデータからどれほど離れているかも分かる。最小値、第1四分位数、中央値、第3四分位数、最大値の5つから作成する。これらを基準に、ほかのデータの値がどのくらい近いかを比較する。
To construct a box plot, use a horizontal or vertical number line and a rectangular box. The smallest and largest data values label the endpoints of the axis. The first quartile marks one end of the box and the third quartile marks the other end of the box. Approximately the middle 50 percent of the data fall inside the box. The "whiskers" extend from the ends of the box to the smallest and largest data values. The median or second quartile can be between the first and third quartiles, or it can be one, or the other, or both. The box plot gives a good, quick picture of the data.
英語のヒント
箱ひげ図を作るには、横または縦の数直線と、長方形の箱を使う。軸の端にはデータの最小値と最大値を示す。箱の一端は第1四分位数、もう一端は第3四分位数である。中央の約50%のデータが箱の中に入る。「ひげ」は箱の両端から、データの最小値と最大値まで延びる。中央値、すなわち第2四分位数は、第1、第3四分位数の間にある場合も、片方または両方と一致する場合もある。箱ひげ図は、データの姿をすばやく捉えられる優れた図である。
Consider, again, this dataset.
もう一度、このデータセットを考えよう。
- 1
- 1
- 2
- 2
- 4
- 6
- 6.8
- 7.2
- 8
- 8.3
- 9
- 10
- 10
- 11.5
The first quartile is two, the median is seven, and the third quartile is nine. The smallest value is one, and the largest value is 11.5. The following image shows the constructed box plot.
第1四分位数は2、中央値は7、第3四分位数は9である。最小値は1、最大値は11.5である。作成した箱ひげ図を以下に示す。

Figure 2.27図 2.27
The two whiskers extend from the first quartile to the smallest value and from the third quartile to the largest value. The median is shown with a dashed line.
2本のひげは、第1四分位数から最小値へ、第3四分位数から最大値へ延びる。中央値は破線で示す。
Example 2.23例題 2.23
The following data are the heights of 40 students in a statistics class.
以下は、統計学のクラスの学生40人の身長データである。
- 59
- 60
- 61
- 62
- 62
- 63
- 63
- 64
- 64
- 64
- 65
- 65
- 65
- 65
- 65
- 65
- 65
- 65
- 65
- 66
- 66
- 67
- 67
- 68
- 68
- 69
- 70
- 70
- 70
- 70
- 70
- 71
- 71
- 72
- 72
- 73
- 74
- 74
- 75
- 77
Construct a box plot with the following properties; the calculator intructions for the minimum and maximum values as well as the quartiles follow the example.
以下の値を持つ箱ひげ図を作成せよ。最小値、最大値、四分位数を求める電卓の操作手順は、例の後に示す。
- Minimum value = 59最小値=59
- Maximum value = 77最大値=77
- Q1: First quartile = 64.5Q1:第1四分位数=64.5
- Q2: Second quartile or median= 66Q2:第2四分位数、すなわち中央値=66
- Q3: Third quartile = 70Q3:第3四分位数=70

Figure 2.28図 2.28
- Each quarter has approximately 25% of the data.4分割された各区間には、データの約25%が入る。
- The spreads of the four quarters are 64.5 – 59 = 5.5 (first quarter), 66 – 64.5 = 1.5 (second quarter), 70 – 66 = 4 (third quarter), and 77 – 70 = 7 (fourth quarter). So, the second quarter has the smallest spread and the fourth quarter has the largest spread.4つの区間の幅は、第1区間が64.5−59=5.5、第2区間が66−64.5=1.5、第3区間が70−66=4、第4区間が77−70=7である。したがって、第2区間の散らばりが最小、第4区間が最大となる。
- Range = maximum value – the minimum value = 77 – 59 = 18範囲=最大値−最小値=77−59=18
- Interquartile Range: IQR = Q3 – Q1 = 70 – 64.5 = 5.5.四分位範囲:IQR=Q3−Q1=70−64.5=5.5。
- The interval 59–65 has more than 25% of the data so it has more data in it than the interval 66 through 70 which has 25% of the data.区間59~65にはデータの25%を超える値が入るので、25%が入る区間66~70よりデータが多い。
- The middle 50% (middle half) of the data has a range of 5.5 inches.データの中央50%(中央の半分)の範囲は5.5インチである。
Using the Calculator電卓の操作
For some sets of data, some of the largest value, smallest value, first quartile, median, and third quartile may be the same. For instance, you might have a data set in which the median and the third quartile are the same. In this case, the diagram would not have a dotted line inside the box displaying the median. The right side of the box would display both the third quartile and the median. For example, if the smallest value and the first quartile were both one, the median and the third quartile were both five, and the largest value was seven, the box plot would look like:
データセットによっては、最大値、最小値、第1四分位数、中央値、第3四分位数の一部が同じ値になる。例えば、中央値と第3四分位数が等しい場合がある。その場合、箱の中に中央値を示す点線はなく、箱の右端が両方を示す。例えば、最小値と第1四分位数がともに1、中央値と第3四分位数がともに5、最大値が7なら、箱ひげ図は次のようになる。
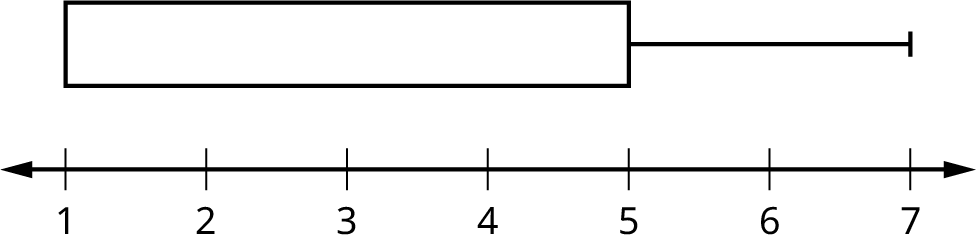
Figure 2.29図 2.29
In this case, at least 25% of the values are equal to one. Twenty-five percent of the values are between one and five, inclusive. At least 25% of the values are equal to five. The top 25% of the values fall between five and seven, inclusive.
この場合、少なくとも25%の値は1であり、25%の値は1以上5以下にある。少なくとも25%の値は5で、上位25%は5以上7以下にある。
Example 2.24例題 2.24
Test scores for a college statistics class held during the day are:
大学の昼間の統計学のクラスの試験の点数は次のとおりである。
- 99
- 56
- 78
- 55.5
- 32
- 90
- 80
- 81
- 56
- 59
- 45
- 77
- 84.5
- 84
- 70
- 72
- 68
- 32
- 79
- 90
Test scores for a college statistics class held during the evening are:
大学の夜間の統計学のクラスの試験の点数は次のとおりである。
- 98
- 78
- 68
- 83
- 81
- 89
- 88
- 76
- 65
- 45
- 98
- 90
- 80
- 84.5
- 85
- 79
- 78
- 98
- 90
- 79
- 81
- 25.5
- Find the smallest and largest values, the median, and the first and third quartile for the day class.昼間のクラスの最小値、最大値、中央値、第1、第3四分位数を求めよ。
- Find the smallest and largest values, the median, and the first and third quartile for the night class.夜間のクラスの最小値、最大値、中央値、第1、第3四分位数を求めよ。
- For each data set, what percentage of the data is between the smallest value and the first quartile? the first quartile and the median? the median and the third quartile? the third quartile and the largest value? What percentage of the data is between the first quartile and the largest value?各データセットについて、最小値と第1四分位数の間、第1四分位数と中央値の間、中央値と第3四分位数の間、第3四分位数と最大値の間に、それぞれ何%のデータが入るか。また、第1四分位数と最大値の間には何%が入るか。
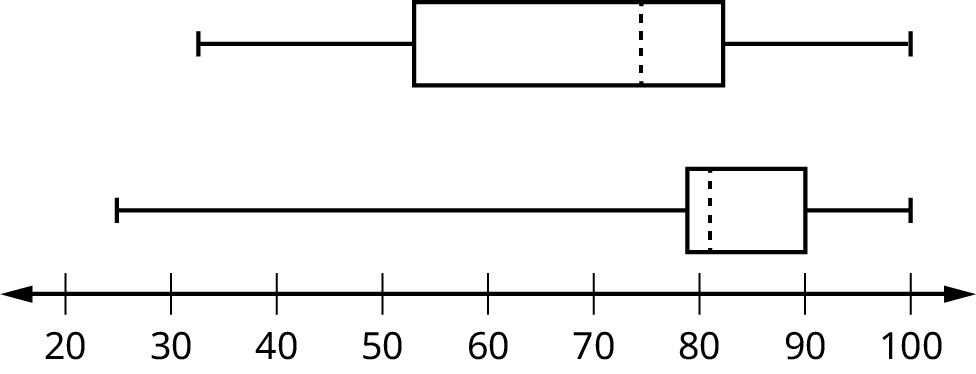
- Create a box plot for each set of data. Use one number line for both box plots.各データセットの箱ひげ図を、同じ数直線上に作成せよ。
- Which box plot has the widest spread for the middle 50% of the data (the data between the first and third quartiles)? What does this mean for that set of data in comparison to the other set of data?中央50%、つまり第1、第3四分位数の間の散らばりが大きいのはどちらの箱ひげ図か。ほかのデータセットと比べて、何を意味するか。
Solution解き方
- Min = 32最小値 = 32
- Q1 = 56
- M = 74.5
- Q3 = 82.5
- Max = 99最大値 = 99
- Min = 25.5最小値 = 25.5
- Q1 = 78
- M = 81
- Q3 = 89
- Max = 98最大値 = 98
- Day class: There are six data values ranging from 32 to 56: 30%. There are six data values ranging from 56 to 74.5: 30%. There are five data values ranging from 74.5 to 82.5: 25%. There are five data values ranging from 82.5 to 99: 25%. There are 16 data values between the first quartile, 56, and the largest value, 99: 75%. Night class:昼間のクラス:32~56には6個(30%)、56~74.5には6個(30%)、74.5~82.5には5個(25%)、82.5~99には5個(25%)の値がある。第1四分位数56と最大値99の間には16個(75%)ある。夜間のクラス:
- Figure 2.30図 2.30
- The first data set has the wider spread for the middle 50% of the data. The IQR for the first data set is greater than the IQR for the second set. This means that there is more variability in the middle 50% of the first data set.第1のデータセットの方が、中央50%の散らばりが大きい。そのIQRは第2のデータセットより大きく、中央50%のばらつきが大きいことを意味する。
Example 2.25例題 2.25
Graph a box-and-whisker plot for the data values shown.
示したデータの箱ひげ図を描け。
- 10
- 10
- 10
- 15
- 35
- 75
- 90
- 95
- 100
- 175
- 420
- 490
- 515
- 515
- 790
The five numbers used to create a box-and-whisker plot are:
箱ひげ図を作る5つの値は、次のとおりである。
- Min: 10最小値:10
- Q1: 15
- Med: 95中央値:95
- Q3: 490
- Max: 790最大値:790
The following graph shows the box-and-whisker plot.
箱ひげ図を以下に示す。



Figure 2.31図 2.31