第2章記述統計
References参考文献
Doyle, Brandon. "TikTok Statistics – Updated Mar 2023." Wallaroo. March 21, 2023. https://wallaroomedia.com/blog/social-media/tiktok-statistics/.
Brandon Doyle「TikTokの統計―2023年3月更新」、Wallaroo、2023年3月21日。https://wallaroomedia.com/blog/social-media/tiktok-statistics/。
“Table 219.20. Public High School Graduates, by Region, State, and Jurisdiction: Selected Years, 1980-81 through 2030-31.” National Center for Education Statistics. Accessed May 24, 2023. https://nces.ed.gov/programs/digest/d21/tables/dt21_219.20.asp.
「表219.20:地域・州・管轄別の公立高校卒業者数:1980~81年度から2030~31年度の選択された年」、全米教育統計センター。2023年5月24日閲覧。https://nces.ed.gov/programs/digest/d21/tables/dt21_219.20.asp。
“Overweight and Obesity: Adult Obesity Facts.” Centers for Disease Control and Prevention. Available online at http://www.cdc.gov/obesity/data/adult.html (accessed September 13, 2013).
「過体重と肥満:成人の肥満に関する情報」、疾病対策予防センター。http://www.cdc.gov/obesity/data/adult.html(2013年9月13日閲覧)。
Chapter Review章の復習
A stem-and-leaf plot is a way to plot data and look at the distribution. In a stem-and-leaf plot, all data values within a class are visible. The advantage in a stem-and-leaf plot is that all values are listed, unlike a histogram, which gives classes of data values. A line graph is often used to represent a set of data values in which a quantity varies with time. These graphs are useful for finding trends. That is, finding a general pattern in data sets including temperature, sales, employment, company profit or cost over a period of time. A bar graph is a chart that uses either horizontal or vertical bars to show comparisons among categories. One axis of the chart shows the specific categories being compared, and the other axis represents a discrete value. Some bar graphs present bars clustered in groups of more than one (grouped bar graphs), and others show the bars divided into subparts to show cumulative effect (stacked bar graphs). Bar graphs are especially useful when categorical data is being used.
英語のヒント
幹葉図は、データを図示して分布を見る方法である。各階級内のデータの値をすべて確認できる。値を階級にまとめるヒストグラムと違い、全数値が列挙されることが利点である。折れ線グラフは、ある量が時間とともに変化するデータを表すのによく使われる。傾向、つまり、ある期間の気温、売上、雇用、企業の利益や費用などのデータの全体的なパターンを見つけるのに役立つ。棒グラフは、横または縦の棒を使ってカテゴリー間を比較する図である。一方の軸に比較するカテゴリー、もう一方の軸に離散的な値を示す。複数の棒をグループにまとめたもの(集合棒グラフ)も、棒を部分に分けて累積効果を示すもの(積み上げ棒グラフ)もある。棒グラフは、カテゴリーデータを扱うときに特に役立つ。
Exercises 1–4練習問題 1–4
For each of the following data sets, create a stem plot and identify any outliers.
以下の各データセットについて、幹葉図を作成し、外れ値があれば示せ。
Exercise 1問題 1
The miles per gallon rating for 30 cars are shown below (lowest to highest).
19, 19, 19, 20, 21, 21, 25, 25, 25, 26, 26, 28, 29, 31, 31, 32, 32, 33, 34, 35, 36, 37, 37, 38, 38, 38, 38, 41, 43, 43
19, 19, 19, 20, 21, 21, 25, 25, 25, 26, 26, 28, 29, 31, 31, 32, 32, 33, 34, 35, 36, 37, 37, 38, 38, 38, 38, 41, 43, 43
30台の車の燃費(1ガロン当たりの走行マイル数)を以下に示す(小さい順)。19, 19, 19, 20, 21, 21, 25, 25, 25, 26, 26, 28, 29, 31, 31, 32, 32, 33, 34, 35, 36, 37, 37, 38, 38, 38, 38, 41, 43, 43
Solution解き方
Stem 幹 |
Leaf 葉 |
|---|---|
1 |
9 9 9 |
2 |
0 1 1 5 5 5 6 6 8 9 |
3 |
1 1 2 2 3 4 5 6 7 7 8 8 8 8 |
4 |
1 3 3 |
Exercise 2問題 2
The height in feet of 25 trees is shown below (lowest to highest).
25, 27, 33, 34, 34, 34, 35, 37, 37, 38, 39, 39, 39, 40, 41, 45, 46, 47, 49, 50, 50, 53, 53, 54, 54
25, 27, 33, 34, 34, 34, 35, 37, 37, 38, 39, 39, 39, 40, 41, 45, 46, 47, 49, 50, 50, 53, 53, 54, 54
25本の木の高さ(フィート)を以下に示す(小さい順)。25, 27, 33, 34, 34, 34, 35, 37, 37, 38, 39, 39, 39, 40, 41, 45, 46, 47, 49, 50, 50, 53, 53, 54, 54
Exercise 3問題 3
The data are the prices of different laptops at an electronics store. Round each value to the nearest ten.
249, 249, 260, 265, 265, 280, 299, 299, 309, 319, 325, 326, 350, 350, 350, 365, 369, 389, 409, 459, 489, 559, 569, 570, 610
249, 249, 260, 265, 265, 280, 299, 299, 309, 319, 325, 326, 350, 350, 350, 365, 369, 389, 409, 459, 489, 559, 569, 570, 610
データは、家電量販店で販売するさまざまなノートパソコンの価格である。各値を最も近い10の倍数に丸めよ。249, 249, 260, 265, 265, 280, 299, 299, 309, 319, 325, 326, 350, 350, 350, 365, 369, 389, 409, 459, 489, 559, 569, 570, 610
Solution解き方
Stem 幹 |
Leaf 葉 |
|---|---|
2 |
5 5 6 7 7 8 |
3 |
0 0 1 2 3 3 5 5 5 7 7 9 |
4 |
1 6 9 |
5 |
6 7 7 |
6 |
1 |
Exercise 4問題 4
The data are daily high temperatures in a town for one month.
61, 61, 62, 64, 66, 67, 67, 67, 68, 69, 70, 70, 70, 71, 71, 72, 74, 74, 74, 75, 75, 75, 76, 76, 77, 78, 78, 79, 79, 95
61, 61, 62, 64, 66, 67, 67, 67, 68, 69, 70, 70, 70, 71, 71, 72, 74, 74, 74, 75, 75, 75, 76, 76, 77, 78, 78, 79, 79, 95
データは、ある町の1か月間の日々の最高気温である。61, 61, 62, 64, 66, 67, 67, 67, 68, 69, 70, 70, 70, 71, 71, 72, 74, 74, 74, 75, 75, 75, 76, 76, 77, 78, 78, 79, 79, 95
Exercises 5–11練習問題 5–11
For the next three exercises, use the data to construct a line graph.
続く3問では、データを使って折れ線グラフを作成せよ。
Exercise 5問題 5
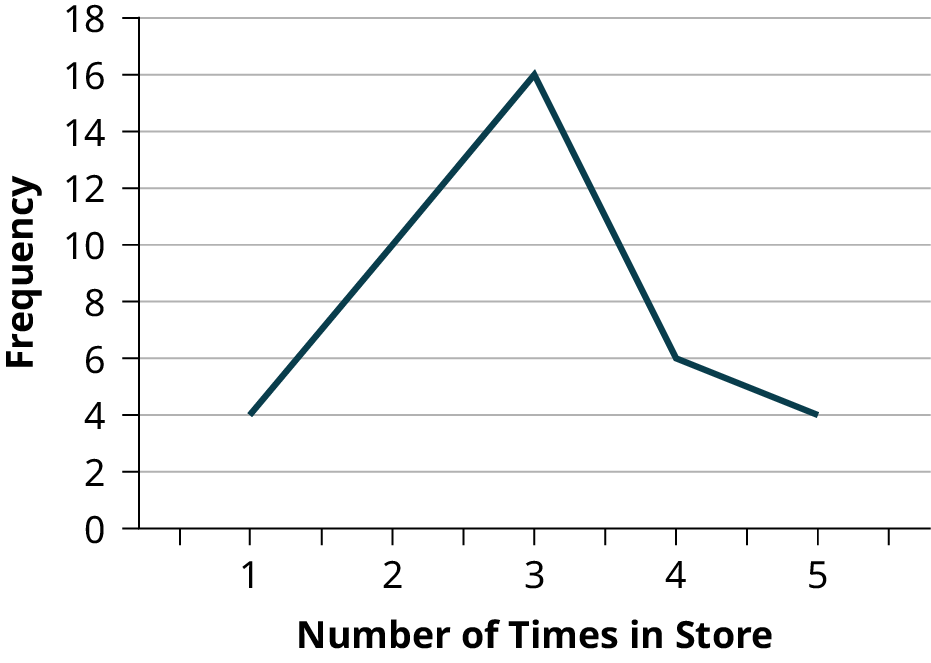
In a survey, 40 people were asked how many times they visited a store before making a major purchase. The results are shown in Table 2.15.
ある調査で、40人に、大きな買い物をする前に何回店を訪れたか尋ねた。結果を表2.15に示す。
Number of times in store 来店回数 |
Frequency 度数 |
|---|---|
1 |
4 |
2 |
10 |
3 |
16 |
4 |
6 |
5 |
4 |
Exercise 6問題 6
In a survey, several people were asked how many years it has been since they purchased a mattress. The results are shown in Table 2.16.
ある調査で、数人に、マットレスを購入してから何年たったか尋ねた。結果を表2.16に示す。
Years since last purchase 前回の購入からの年数 |
Frequency 度数 |
|---|---|
0 |
2 |
1 |
8 |
2 |
13 |
3 |
22 |
4 |
16 |
5 |
9 |
Exercise 7問題 7
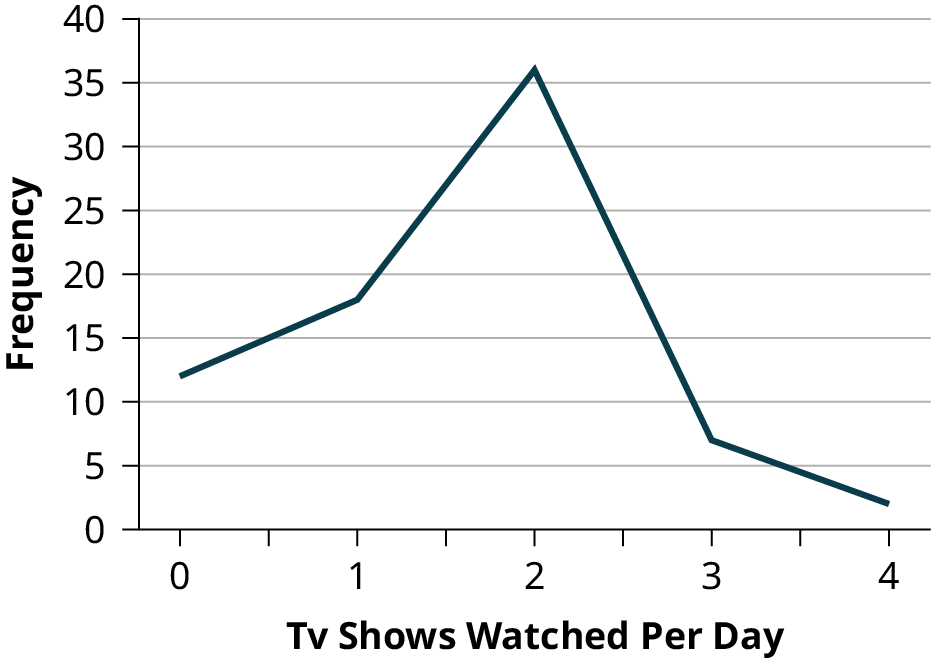
Several children were asked how many TV shows they watch each day. The results of the survey are shown in Table 2.17.
数人の子どもに、毎日何本テレビ番組を見るか尋ねた。調査結果を表2.17に示す。
Number of TV Shows テレビ番組の本数 |
Frequency 度数 |
|---|---|
0 |
12 |
1 |
18 |
2 |
36 |
3 |
7 |
4 |
2 |
Exercise 8問題 8
The students in Ms. Ramirez’s math class have birthdays in each of the four seasons. Table 2.18 shows the four seasons, the number of students who have birthdays in each season, and the percentage (%) of students in each group. Construct a bar graph showing the number of students.
ラミレス先生の数学のクラスには、四季それぞれに誕生日を迎える生徒がいる。表2.18は、4つの季節と、その季節に誕生日を迎える生徒数および百分率(%)を示す。生徒数を示す棒グラフを作成せよ。
Seasons 季節 |
Number of students 生徒数 |
Proportion of population 人口に占める割合 |
|---|---|---|
Spring 春 |
8 |
24% |
Summer 夏 |
9 |
26% |
Autumn 秋 |
11 |
32% |
Winter 冬 |
6 |
18% |
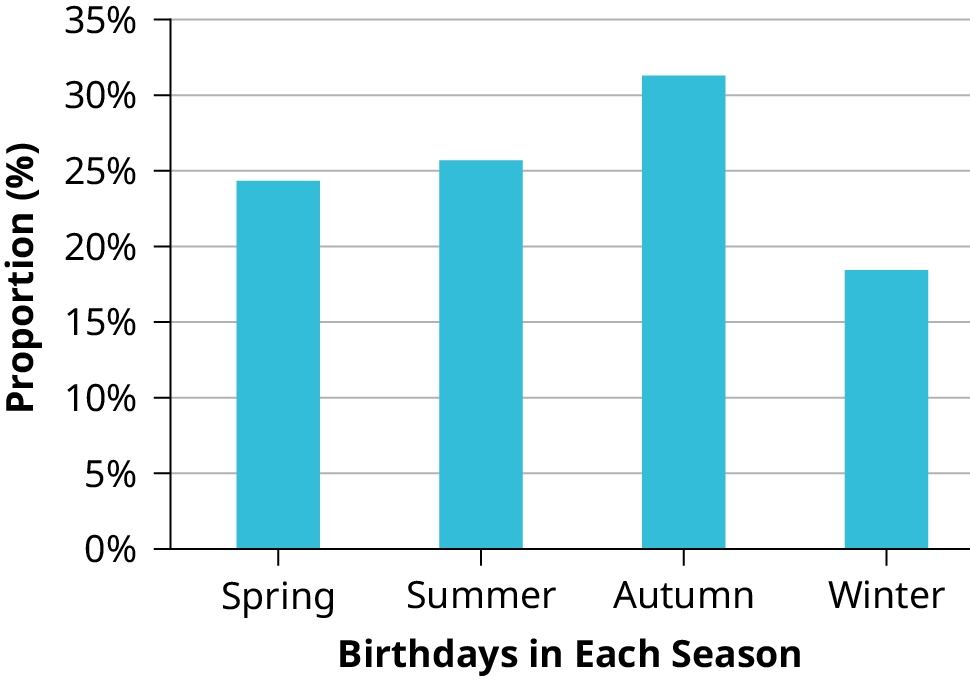
Exercise 9問題 9
Using the data from Ms. Ramirez’s math class supplied in Table 2.18, construct a bar graph showing the percentages.
表2.18のラミレス先生の数学のクラスのデータを使って、百分率を示す棒グラフを作成せよ。
Exercise 10問題 10
David County has six high schools. Each school sent students to participate in a county-wide science competition. Table 2.19 shows the percentage breakdown of competitors from each school, and the percentage of the entire student population of the county that goes to each school. Construct a bar graph that shows the population percentage of competitors from each school.
デイビッド郡には高校が6校ある。各校は、郡全体の科学コンテストに生徒を送り出した。表2.19は、参加者の学校別の百分率と、郡の全生徒に対して各校の生徒が占める百分率を示す。参加者全体に対して各校の参加者が占める百分率を、棒グラフで表せ。
High School 高校 |
Science competition population 科学コンテスト参加者人口 |
Overall student population 全生徒人口 |
|---|---|---|
Alabaster アラバスター |
28.9% |
8.6% |
Concordia コンコルディア |
7.6% |
23.2% |
Genoa ジェノア |
12.1% |
15.0% |
Mocksville モックスビル |
18.5% |
14.3% |
Tynneson ティネソン |
24.2% |
10.1% |
West End ウエストエンド |
8.7% |
28.8% |
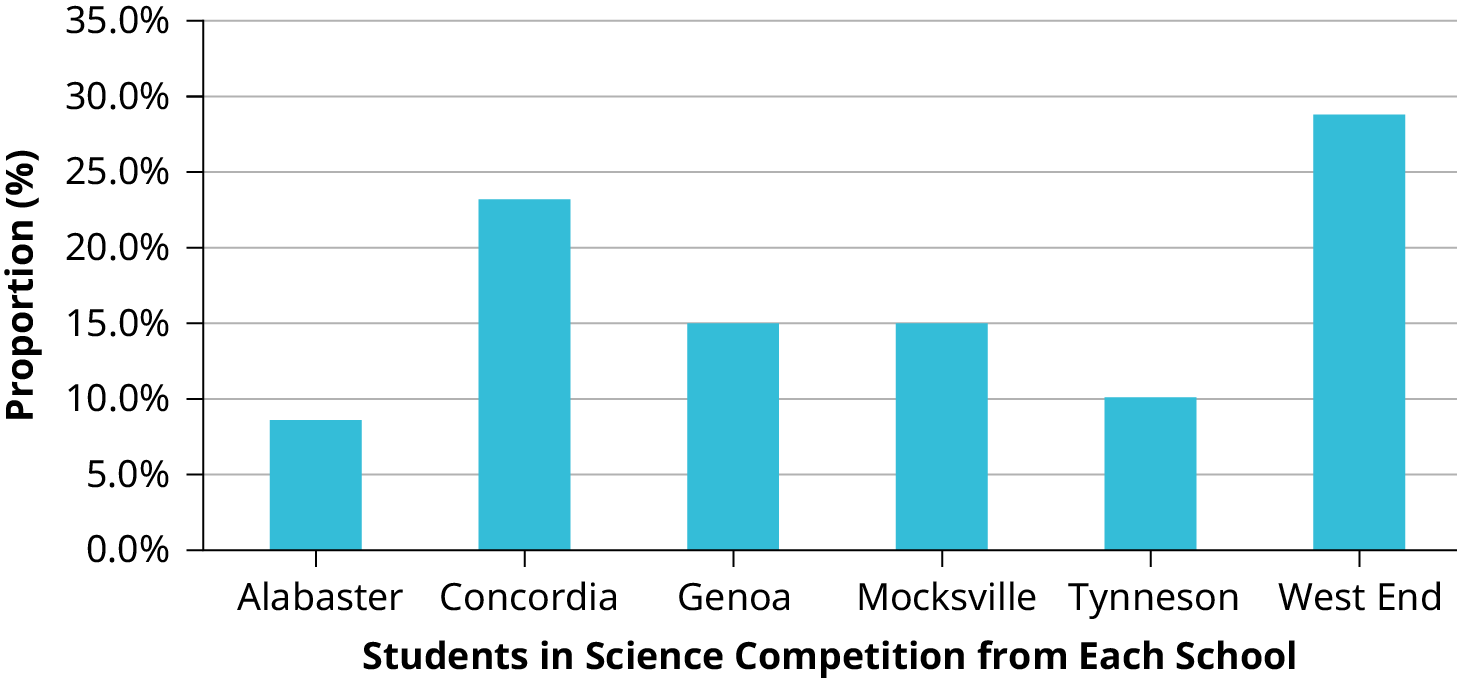
Exercise 11問題 11
Use the data from the David County science competition supplied in Table 2.19. Construct a bar graph that shows the county-wide population percentage of students at each school.
表2.19のデイビッド郡の科学コンテストのデータを使え。郡全体の生徒に対する各校の生徒の百分率を示す棒グラフを作成せよ。