第2章記述統計
Formula Review公式の復習
Where f = interval frequencies and m = interval midpoints.
ここで、fは区間の度数、mは区間の中点である。
Exercises 60練習問題 60
Exercise 60問題 60
Find the mean for the following frequency tables.
以下の度数表の平均値を求めよ。
- Grade点数Frequency度数49.5–59.5259.5–69.5369.5–79.5879.5–89.51289.5–99.55Table 2.61表 2.61
- Daily Low Temperature日最低気温Frequency度数49.5–59.55359.5–69.53269.5–79.51579.5–89.5189.5–99.50Table 2.62表 2.62
- Points per Game1試合当たりの得点Frequency度数49.5–59.51459.5–69.53269.5–79.51579.5–89.52389.5–99.52Table 2.63表 2.63
Exercises 61–63練習問題 61–63
Use the following information to answer the next three exercises: The following data show the lengths of boats moored in a marina. The data are ordered from smallest to largest:
英語のヒント
次の情報で、続く3問に答えよ。以下は、マリーナに係留された船の長さを小さい順に並べたデータである。
- 16
- 17
- 19
- 20
- 20
- 21
- 23
- 24
- 25
- 25
- 25
- 26
- 26
- 27
- 27
- 27
- 28
- 29
- 30
- 32
- 33
- 33
- 34
- 35
- 37
- 39
- 40
Exercise 61問題 61
Calculate the mean.
平均値を計算せよ。
Solution解き方
Mean: 16 + 17 + 19 + 20 + 20 + 21 + 23 + 24 + 25 + 25 + 25 + 26 + 26 + 27 + 27 + 27 + 28 + 29 + 30 + 32 + 33 + 33 + 34 + 35 + 37 + 39 + 40 = 738;
平均値:16+17+19+20+20+21+23+24+25+25+25+26+26+27+27+27+28+29+30+32+33+33+34+35+37+39+40=738;
= 27.33
Exercise 62問題 62
Identify the median.
中央値を求めよ。
Exercise 63問題 63
Identify the mode.
最頻値を求めよ。
Solution解き方
The most frequent lengths are 25 and 27, which occur three times. Mode = 25, 27
最も多い長さは25と27で、それぞれ3回現れる。最頻値=25、27。
Exercises 64–66練習問題 64–66
Use the following information to answer the next three exercises: Sixty-five randomly selected car salespersons were asked the number of cars they generally sell in one week. Fourteen people answered that they generally sell three cars; nineteen generally sell four cars; twelve generally sell five cars; nine generally sell six cars; eleven generally sell seven cars. Calculate the following:
次の情報で、続く3問に答えよ。無作為に選んだ自動車販売員65人に、通常1週間で何台売るか尋ねた。14人は3台、19人は4台、12人は5台、9人は6台、11人は7台と答えた。次を計算せよ。
Exercise 64問題 64
sample mean = = _______
標本平均==_______
Exercise 65問題 65
median = _______
中央値=_______
Solution解き方
4
Exercise 66問題 66
mode = _______
最頻値=_______
Homework宿題
Exercises 67–68練習問題 67–68
Exercise 67問題 67
The countries with the highest rates of obesity in the world have obesity rates that range from 11.4% to 74.6%. This data is summarized in the following table.
世界で肥満率が高い国々の肥満率は、11.4~74.6%にわたる。このデータを次の表にまとめた。
Percent of Population 人口の百分率 |
Number of Countries 国数 |
|---|---|
11.4–20.45 |
29 |
20.45–29.45 |
13 |
29.45–38.45 |
4 |
38.45–47.45 |
0 |
47.45–56.45 |
2 |
56.45–65.45 |
1 |
65.45–74.45 |
0 |
74.45–83.45 |
1 |
- What is the best estimate of the average obesity percentage for these countries?これらの国々の平均肥満率の最良の推定値はいくつか。
- The United States has an average obesity rate of 33.9%. Is this rate above average or below?米国の平均肥満率は33.9%である。これは平均より高いか、低いか。
- How does the United States compare to other countries?米国は、ほかの国々と比べてどうか。
Exercise 68問題 68
Table 2.65 gives the percent of children under five considered to be underweight. What is the best estimate for the mean percentage of underweight children?
表2.65は、低体重とされる5歳未満の子どもの百分率を示す。低体重の子どもの平均百分率の最良の推定値はいくつか。
Percent of Underweight Children 低体重の子どもの百分率 |
Number of Countries 国数 |
|---|---|
16–21.45 |
23 |
21.45–26.9 |
4 |
26.9–32.35 |
9 |
32.35–37.8 |
7 |
37.8–43.25 |
6 |
43.25–48.7 |
1 |
Solution解き方
The mean percentage,
平均百分率はである。
Bringing It Together総合問題
Exercises 69練習問題 69
Exercise 69問題 69
Javier and Ercilia are supervisors at a shopping mall. Each was given the task of estimating the mean distance that shoppers live from the mall. They each randomly surveyed 100 shoppers. The samples yielded the following information.
ハビエルとエルシリアは、ショッピングモールの管理担当者である。2人はそれぞれ、買い物客の自宅からモールまでの平均距離を推定するよう任された。各自が100人の買い物客を無作為に調査し、次の情報を得た。
Javier ハビエル |
Ercilia エルシリア |
|
|---|---|---|
6.0 miles 6.0マイル |
6.0 miles 6.0マイル |
|
4.0 miles 4.0マイル |
7.0 miles 7.0マイル |
- How can you determine which survey was correct ?どちらの調査が正しかったか、どう判断できるか。
- Explain what the difference in the results of the surveys implies about the data.調査結果の違いがデータについて何を示すか、説明せよ。
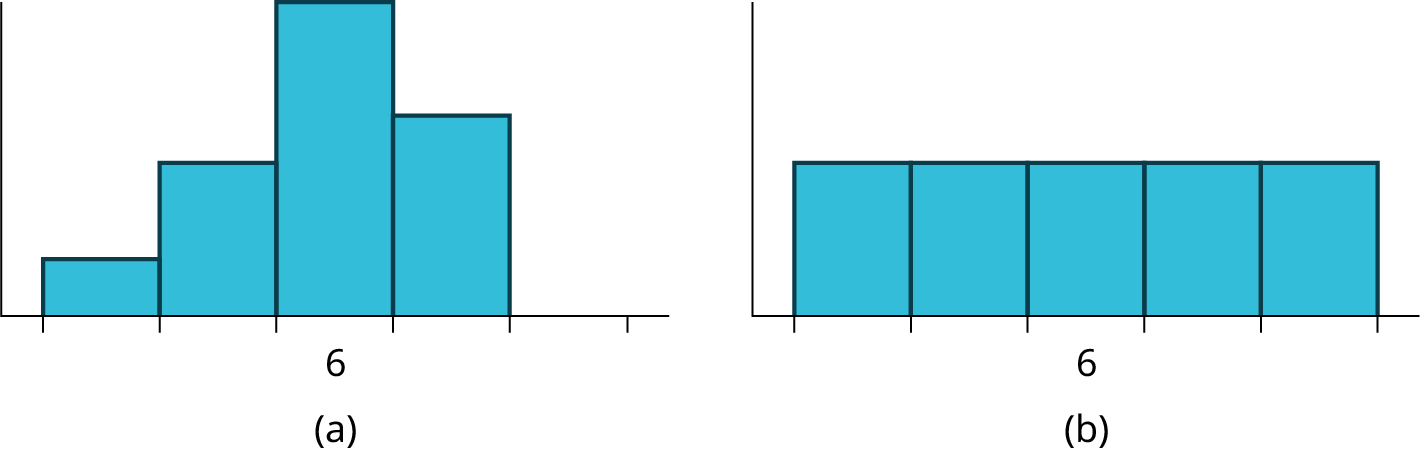
- If the two histograms depict the distribution of values for each supervisor, which one depicts Ercilia's sample? How do you know?
英語のヒント
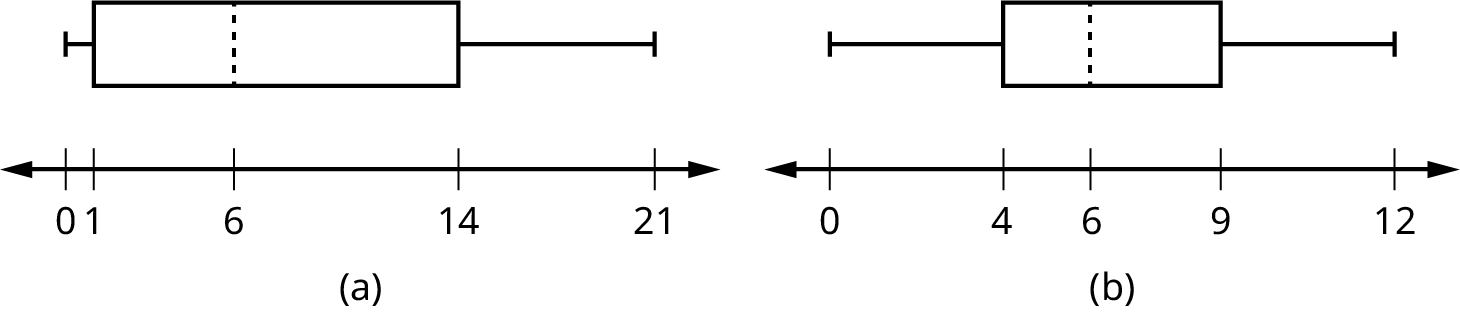
2つのヒストグラムがそれぞれの担当者の値の分布を示すなら、どちらがエルシリアの標本か。どうして分かるか。Figure 2.37図 2.37 - If the two box plots depict the distribution of values for each supervisor, which one depicts Ercilia’s sample? How do you know?2つの箱ひげ図がそれぞれの担当者の値の分布を示すなら、どちらがエルシリアの標本か。どうして分かるか。Figure 2.38図 2.38


Exercises 70–72練習問題 70–72
Use the following information to answer the next three exercises: We are interested in the number of years students in a particular elementary statistics class have lived in California. The information in the following table is from the entire section.
次の情報で、続く3問に答えよ。ある初等統計学のクラスの学生が、カリフォルニア州に住んできた年数を調べる。次の表は、クラス全員から得た情報である。
Number of years 年数 |
Frequency 度数 |
Number of years 年数 |
Frequency 度数 |
|---|---|---|---|
7 |
1 |
22 |
1 |
14 |
3 |
23 |
1 |
15 |
1 |
26 |
1 |
18 |
1 |
40 |
2 |
19 |
4 |
42 |
2 |
20 |
3 |
||
Total = 20 合計=20 |
Exercise 70問題 70
What is the IQR?
IQRはいくつか。
- 8
- 11
- 15
- 35
Solution解き方
a
Exercise 71問題 71
What is the mode?
最頻値はいくつか。
- 19
- 19.5
- 14 and 2014と20
- 22.65
Exercise 72問題 72
Is this a sample or the entire population?
これは標本か、母集団全体か。
- sample標本
- entire population母集団全体
- neitherどちらでもない
Solution解き方
b
Frequency Table
度数表
a data representation in which grouped data is displayed along with the corresponding frequencies
階級にまとめたデータと、対応する度数を一緒に示すデータの表現。
Mean
平均値
a number that measures the central tendency of the data; a common name for mean is 'average.' The term 'mean' is a shortened form of 'arithmetic mean.' By definition, the mean for a sample (denoted by ) is , and the mean for a population (denoted by μ) is .
データの中心傾向を測る数値。meanの一般的な呼び名はaverageで、meanはarithmetic mean(算術平均)の略である。定義により、標本の平均(で表す)は、母集団の平均(μで表す)はとなる。
Median
中央値
a number that separates ordered data into halves; half the values are the same number or smaller than the median and half the values are the same number or larger than the median. The median may or may not be part of the data.
順序に並べたデータを半分に分ける数値。半分は中央値以下、もう半分は中央値以上である。中央値は、データ中に存在する場合もしない場合もある。
Midpoint
中点
the mean of an interval in a frequency table
度数表の区間の平均値。
Mode
最頻値
the value that appears most frequently in a set of data
データセットで最も頻繁に現れる値。