第2章記述統計
Bringing It Together総合問題
Exercises 113–119練習問題 113–119
Exercise 113問題 113
Twenty-five randomly selected students were asked the number of movies they watched the previous week. The results are as follows:
無作為に選んだ学生25人に、前の週に見た映画の本数を尋ねた。結果は次のとおりである。
# of movies 映画の本数 |
Frequency 度数 |
|---|---|
0 |
5 |
1 |
9 |
2 |
6 |
3 |
4 |
4 |
1 |
- Find the sample mean .標本平均を求めよ。
- Find the approximate sample standard deviation, s.標本標準偏差sの近似値を求めよ。
Solution解き方
- 1.48
- 1.12
Exercise 114問題 114
Forty randomly selected students were asked the number of pairs of sneakers they owned. Let X = the number of pairs of sneakers owned. The results are as follows:
英語のヒント
無作為に選んだ40人の学生に、持っているスニーカーの足数を尋ねた。Xをスニーカーの所有足数とする。結果は次のとおりである。
X |
Frequency 度数 |
|---|---|
1 |
2 |
2 |
5 |
3 |
8 |
4 |
12 |
5 |
12 |
6 |
0 |
7 |
1 |
- Find the sample mean標本平均を求めよ。
- Find the sample standard deviation, s標本標準偏差sを求めよ。
- Construct a histogram of the data.データのヒストグラムを作成せよ。
- Complete the columns of the chart.表の各列を完成させよ。
- Find the first quartile.第1四分位数を求めよ。
- Find the median.中央値を求めよ。
- Find the third quartile.第3四分位数を求めよ。
- Construct a box plot of the data.データの箱ひげ図を作成せよ。
- What percent of the students owned at least five pairs?学生の何%が5足以上持っていたか。
- Find the 40th percentile.第40パーセンタイルを求めよ。
- Find the 90th percentile.第90パーセンタイルを求めよ。
- Construct a line graph of the dataデータの線グラフを描け。
- Construct a stemplot of the dataデータの幹葉図を作れ。
Exercise 115問題 115
Following are the published weights (in pounds) of all of the team members of the San Francisco 49ers from a previous year.
以下は、過去のある年に公表されたサンフランシスコ・フォーティナイナーズの全選手の体重(ポンド)である。
177; 205; 210; 210; 232; 205; 185; 185; 178; 210; 206; 212; 184; 174; 185; 242; 188; 212; 215; 247; 241; 223; 220; 260; 245; 259; 278; 270; 280; 295; 275; 285; 290; 272; 273; 280; 285; 286; 200; 215; 185; 230; 250; 241; 190; 260; 250; 302; 265; 290; 276; 228; 265
- Organize the data from smallest to largest value.データを小さい順に並べよ。
- Find the median.中央値を求めよ。
- Find the first quartile.第1四分位数を求めよ。
- Find the third quartile.第3四分位数を求めよ。
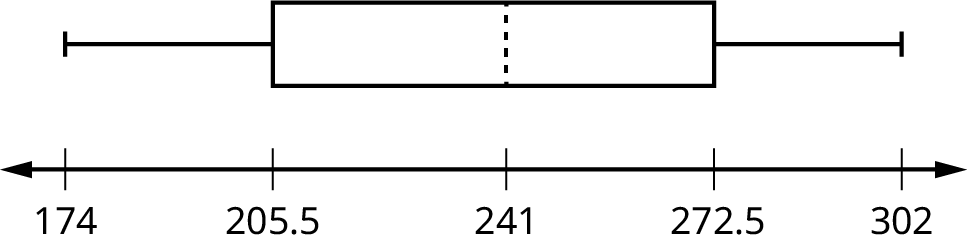
- Construct a box plot of the data.データの箱ひげ図を作成せよ。
- The middle 50% of the weights are from _______ to _______.体重の中央50%は、_______から_______の範囲にある。
- If our population were all professional football players, would the above data be a sample of weights or the population of weights? Why?すべてのプロアメリカンフットボール選手を母集団とすると、上記の体重データは標本か、母集団か。なぜか。
- Assume the population was the San Francisco 49ers. Find:サンフランシスコ・フォーティナイナーズを母集団として、次を求めよ。
- the population mean, μ.母平均μ。
- the population standard deviation, σ.母標準偏差σ。
- the weight that is two standard deviations below the mean.平均より標準偏差2つ分低い体重。
- When Steve Young, quarterback, played football, he weighed 205 pounds. How many standard deviations above or below the mean was he?クォーターバックのスティーブ・ヤングは、現役時代の体重が205ポンドだった。平均から標準偏差何個分高いか、または低いか。
- That same year, the mean weight for the Dallas Cowboys was 240.08 pounds with a standard deviation of 44.38 pounds. Emmit Smith weighed in at 209 pounds. With respect to his team, who was lighter, Smith or Young? How did you determine your answer?同じ年、ダラス・カウボーイズの平均体重は240.08ポンド、標準偏差は44.38ポンドだった。エミット・スミスは209ポンドだった。自分のチームと比べると、スミスとヤングはどちらが軽いか。どう求めたか。
Solution解き方
- 174; 177; 178; 184; 185; 185; 185; 185; 188; 190; 200; 205; 205; 206; 210; 210; 210; 212; 212; 215; 215; 220; 223; 228; 230; 232; 241; 241; 242; 245; 247; 250; 250; 259; 260; 260; 265; 265; 270; 272; 273; 275; 276; 278; 280; 280; 285; 285; 286; 290; 290; 295; 302
- 241
- 205.5
- 272.5
- 205.5, 272.5
- sample標本
- 236.34
- 37.50
- 161.34
- 0.84 std. dev. below the mean平均より標準偏差0.84個分低い。
- Youngヤング
Exercise 116問題 116
One hundred teachers attended a seminar on mathematical problem solving. The attitudes of a representative sample of 12 of the teachers were measured before and after the seminar. A positive number for change in attitude indicates that a teacher's attitude toward math became more positive. The 12 change scores are as follows:
英語のヒント
数学の問題解決についてのセミナーに教師100人が参加した。このうち、代表性のある12人の標本について、セミナーの前後で数学への態度を測った。態度の変化が正の値なら、数学に対して以前より前向きになったことを示す。12人の変化の得点は次のとおりである。
- 3
- 8
- –1
- 2
- 0
- 5
- –3
- 1
- –1
- 6
- 5
- –2
- What is the mean change score?変化の得点の平均はいくつか。
- What is the standard deviation for this population?この母集団の標準偏差はいくつか。
- What is the median change score?変化の得点の中央値はいくつか。
- Find the change score that is 2.2 standard deviations below the mean.平均より標準偏差2.2個分低い変化の得点を求めよ。
Exercise 117問題 117
Refer to Figure 2.62 determine which of the following are true and which are false. Explain your solution to each part in complete sentences.
図2.62を参照し、次の各文が正しいか誤りかを判定せよ。それぞれの答えを、完全な文章で説明せよ。
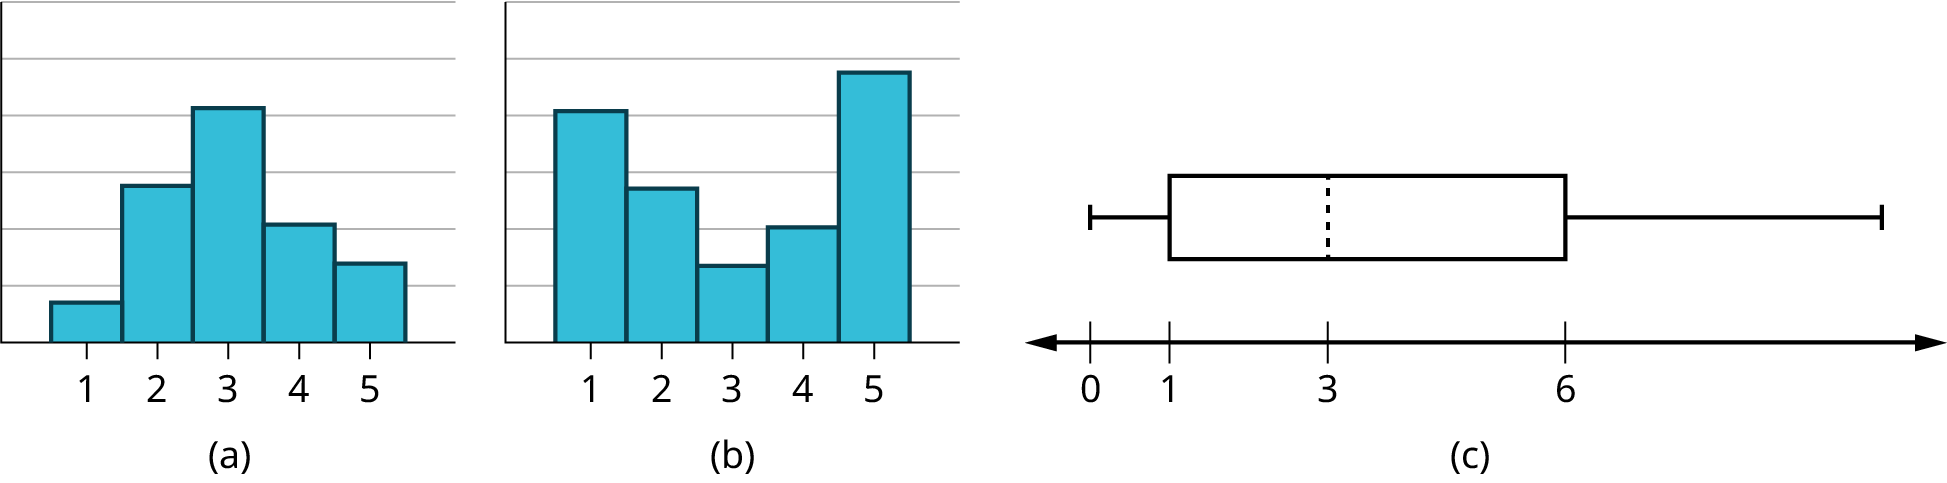


Figure 2.62図 2.62
- The medians for all three graphs are the same.3つのグラフの中央値はすべて同じである。
- We cannot determine if any of the means for the three graphs is different.3つのグラフの平均値に違いがあるかどうかは、判断できない。
- The standard deviation for graph b is larger than the standard deviation for graph a.グラフbの標準偏差は、グラフaの標準偏差より大きい。
- We cannot determine if any of the third quartiles for the three graphs is different.3つのグラフの第3四分位数に違いがあるかどうかは、判断できない。
Solution解き方
- True正しい。
- True正しい。
- True正しい。
- False誤り。
Exercise 118問題 118
In a recent issue of the IEEE Spectrum, 84 engineering conferences were announced. Four conferences lasted two days. Thirty-six lasted three days. Eighteen lasted four days. Nineteen lasted five days. Four lasted six days. One lasted seven days. One lasted eight days. One lasted nine days. Let X = the length (in days) of an engineering conference.
英語のヒント
IEEE Spectrumの最近の号に、工学系の会議84件が掲載された。開催日数が2日間の会議は4件、3日間は36件、4日間は18件、5日間は19件、6日間は4件、7日間、8日間、9日間はそれぞれ1件だった。Xを工学系会議の開催日数とする。
- Organize the data in a chart.データを表にまとめよ。
- Find the median, the first quartile, and the third quartile.中央値、第1四分位数、第3四分位数を求めよ。
- Find the 65th percentile.第65パーセンタイルを求めよ。
- Find the 10th percentile.第10パーセンタイルを求めよ。
- Construct a box plot of the data.データの箱ひげ図を作成せよ。
- The middle 50% of the conferences last from _______ days to _______ days.中央50%の会議の開催日数は、_______日から_______日である。
- Calculate the sample mean of days of engineering conferences.工学系会議の開催日数の標本平均を求めよ。
- Calculate the sample standard deviation of days of engineering conferences.工学系会議の開催日数の標本標準偏差を求めよ。
- Find the mode.最頻値を求めよ。
- If you were planning an engineering conference, which would you choose as the length of the conference: mean; median; or mode? Explain why you made that choice.工学系の会議を企画するなら、開催日数には平均値、中央値、最頻値のどれを選ぶか。選んだ理由を説明せよ。
- Give two reasons why you think that three to five days seem to be popular lengths of engineering conferences.工学系会議の開催日数として、3~5日間がよく選ばれると思われる理由を2つ挙げよ。
Exercise 119問題 119
A survey of enrollment at 35 community colleges across the United States yielded the following figures:
英語のヒント
米国各地のコミュニティカレッジ35校の在籍者数を調べたところ、次の数値が得られた。
6414; 1550; 2109; 9350; 21828; 4300; 5944; 5722; 2825; 2044; 5481; 5200; 5853; 2750; 10012; 6357; 27000; 9414; 7681; 3200; 17500; 9200; 7380; 18314; 6557; 13713; 17768; 7493; 2771; 2861; 1263; 7285; 28165; 5080; 11622
- Organize the data into a chart with six intervals of equal width from 0 to 30,000. Label the two columns "Enrollment" and "Frequency."0~30,000を等幅の6階級に分けた表にデータをまとめよ。2つの列には「在籍者数」「度数」と見出しを付けよ。
- Construct a histogram of the data.データのヒストグラムを作成せよ。
- If you were to build a new community college, which piece of information would be more valuable: the mode or the mean?新たにコミュニティカレッジを設立するとしたら、最頻値と平均値のどちらの情報が役立つか。
- Calculate the sample mean.標本平均を求めよ。
- Calculate the sample standard deviation.標本標準偏差を求めよ。
- A school with an enrollment of 8000 would be how many standard deviations away from the mean?在籍者数8,000人の学校は、平均から標準偏差何個分離れているか。
Solution解き方
- Enrollment在籍者数Frequency度数1000-5000105000-100001610000-15000315000-20000320000-25000125000-300002Table 2.86表 2.86
- Answers may vary.解答はさまざまである。
- mode最頻値
- 8628.74
- 6943.88
- –0.09
Exercises 120–122練習問題 120–122
Use the following information to answer the next two exercises. X = the number of days per week that 100 clients use a particular exercise facility.
次の2問には、以下の情報を使え。Xは、100人の利用者がある運動施設を週に何日使うかを表す。
x |
Frequency 度数 |
|---|---|
0 |
3 |
1 |
12 |
2 |
33 |
3 |
28 |
4 |
11 |
5 |
9 |
6 |
4 |
Exercise 120問題 120
The 80th percentile is _____
第80パーセンタイルは_____である。
- 5
- 80
- 3
- 4
Exercise 121問題 121
The number that is 1.5 standard deviations BELOW the mean is approximately _____
平均より標準偏差1.5個分低い値は、およそ_____である。
- 0.7
- 4.8
- –2.8
- Cannot be determined判断できない
Solution解き方
a
Exercise 122問題 122
Suppose that a publisher conducted a survey asking adult consumers the number of fiction paperback books they had purchased in the previous month. The results are summarized in the Table 2.88.
英語のヒント
ある出版社が成人の消費者を対象に、前月に購入したペーパーバックのフィクション作品の冊数を調べたとする。結果を表2.88にまとめる。
# of books 本の冊数 |
Freq. 度数 |
Rel. Freq. 相対度数 |
|---|---|---|
0 |
18 |
|
1 |
24 |
|
2 |
24 |
|
3 |
22 |
|
4 |
15 |
|
5 |
10 |
|
7 |
5 |
|
9 |
1 |
- Are there any outliers in the data? Use an appropriate numerical test involving the IQR to identify outliers, if any, and clearly state your conclusion.データに外れ値はあるか。IQRを用いた適切な数値判定によって外れ値があるかを調べ、結論を明確に述べよ。
- If a data value is identified as an outlier, what should be done about it?あるデータの値が外れ値と判定された場合、それをどう扱うべきか。
- Are any data values further than two standard deviations away from the mean? In some situations, statisticians may use this criteria to identify data values that are unusual, compared to the other data values. (Note that this criteria is most appropriate to use for data that is mound-shaped and symmetric, rather than for skewed data.)
英語のヒント
平均から標準偏差2つ分を超えて離れた値はあるか。統計家は場合によって、この基準を使って他の値と比べて通常とは異なる値を見つける。(この基準は、歪んだデータよりも、山型で対称なデータに用いるのが最も適切である。) - Do parts a and c of this problem give the same answer?この問題のaとcでは、同じ答えが得られるか。
- Examine the shape of the data. Which part, a or c, of this question gives a more appropriate result for this data?データの形を調べよ。aとcのどちらが、このデータにより適切な結果を与えるか。
- Based on the shape of the data which is the most appropriate measure of center for this data: mean, median or mode?データの形を踏まえると、中心を表す指標として最適なのは、平均値、中央値、最頻値のどれか。
Standard Deviation
標準偏差
a number that is equal to the square root of the variance and measures how far data values are from their mean; notation: s for sample standard deviation and σ for population standard deviation.
分散の平方根に等しく、データの値が平均からどれほど離れているかを測る数値。標本標準偏差はs、母標準偏差はσで表す。
Variance
分散
mean of the squared deviations from the mean, or the square of the standard deviation; for a set of data, a deviation can be represented as x – where x is a value of the data and is the sample mean. The sample variance is equal to the sum of the squares of the deviations divided by the difference of the sample size and one.
平均からの偏差の2乗の平均、または標準偏差の2乗。データセットの偏差はx−と表せる。xはデータの値、は標本平均である。標本分散は、偏差の2乗の合計を、標本の大きさから1を引いた値で割ったものである。