第2章記述統計
Homework宿題
Exercises 12–13練習問題 12–13
Exercise 12問題 12
Student grades on a chemistry exam were: 77, 78, 76, 81, 86, 51, 79, 82, 84, 99
化学の試験で、生徒の点数は次のとおりだった。77, 78, 76, 81, 86, 51, 79, 82, 84, 99
- Construct a stem-and-leaf plot of the data.データの幹葉図を作成せよ。
- Are there any potential outliers? If so, which scores are they? Why do you consider them outliers?外れ値の候補はあるか。あれば、どの点数か。外れ値と考える理由を述べよ。
Exercise 13問題 13
Table 2.20 contains the percentages of adults who were never married in the 50 U.S. states and Washington, DC.
表2.20は、米国50州とワシントンDCにおける、結婚したことのない成人の百分率を示す。
State 州 |
Percent (%) 百分率(%) |
State 州 |
Percent (%) 百分率(%) |
State 州 |
Percent (%) 百分率(%) |
|---|---|---|---|---|---|
Alabama アラバマ |
32.2 |
Kentucky ケンタッキー |
31.3 |
North Dakota ノースダコタ |
27.2 |
Alaska アラスカ |
24.5 |
Louisiana ルイジアナ |
31.0 |
Ohio オハイオ |
29.2 |
Arizona アリゾナ |
24.3 |
Maine メイン |
26.8 |
Oklahoma オクラホマ |
30.4 |
Arkansas アーカンソー |
30.1 |
Maryland メリーランド |
27.1 |
Oregon オレゴン |
26.8 |
California カリフォルニア |
24.0 |
Massachusetts マサチューセッツ |
23.0 |
Pennsylvania ペンシルベニア |
28.6 |
Colorado コロラド |
21.0 |
Michigan ミシガン |
30.9 |
Rhode Island ロードアイランド |
25.5 |
Connecticut コネチカット |
22.5 |
Minnesota ミネソタ |
24.8 |
South Carolina サウスカロライナ |
31.5 |
Delaware デラウェア |
28.0 |
Mississippi ミシシッピ |
34.0 |
South Dakota サウスダコタ |
27.3 |
Washington, DC ワシントンDC |
22.2 |
Missouri ミズーリ |
30.5 |
Tennessee テネシー |
30.8 |
Florida フロリダ |
26.6 |
Montana モンタナ |
23.0 |
Texas テキサス |
31.0 |
Georgia ジョージア |
29.6 |
Nebraska ネブラスカ |
26.9 |
Utah ユタ |
22.5 |
Hawaii ハワイ |
22.7 |
Nevada ネバダ |
22.4 |
Vermont バーモント |
23.2 |
Idaho アイダホ |
26.5 |
New Hampshire ニューハンプシャー |
25.0 |
Virginia ヴァージニア |
26.0 |
Illinois イリノイ |
28.2 |
New Jersey ニュージャージー |
23.8 |
Washington ワシントン |
25.5 |
Indiana インディアナ |
29.6 |
New Mexico ニューメキシコ |
25.1 |
West Virginia ウェストヴァージニア |
32.5 |
Iowa アイオワ |
28.4 |
New York ニューヨーク |
23.9 |
Wisconsin ウィスコンシン |
26.3 |
Kansas カンザス |
29.4 |
North Carolina ノースカロライナ |
27.8 |
Wyoming ワイオミング |
25.1 |
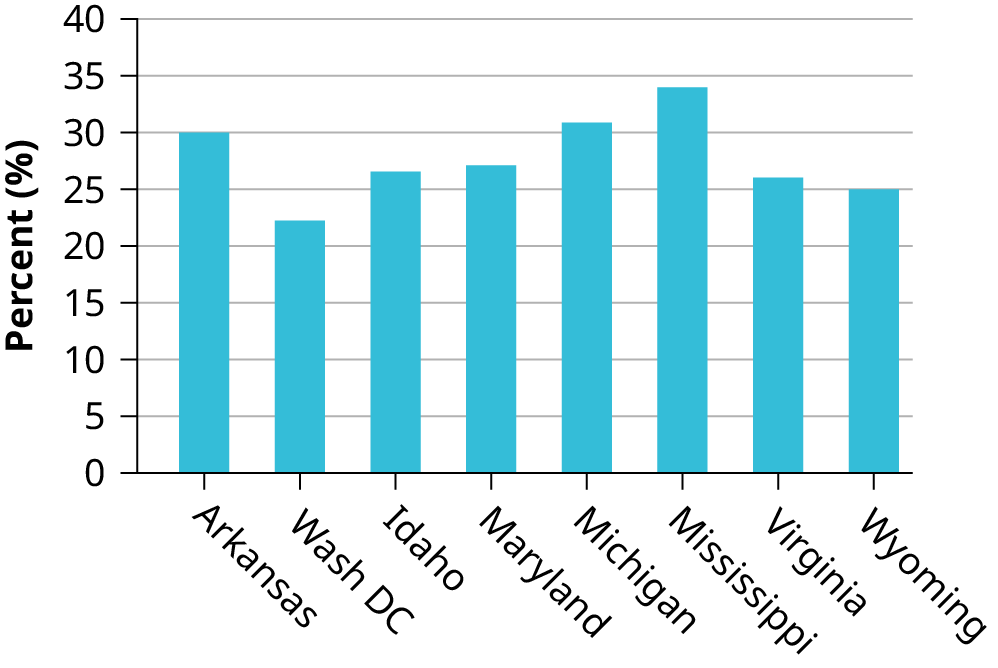
- Use a random number generator to randomly pick eight states. Construct a bar graph of the rates of those eight states.乱数発生器を使い、8州を無作為に選べ。それら8州の比率を棒グラフにせよ。
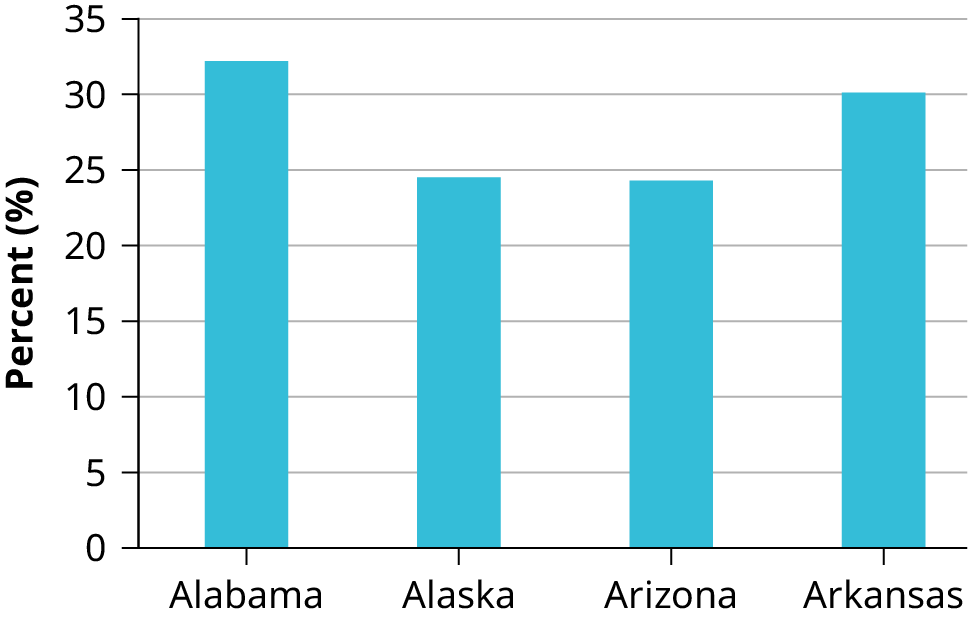
- Construct a bar graph for all the states beginning with the letter "A."名前がAで始まる州すべてについて、棒グラフを作成せよ。
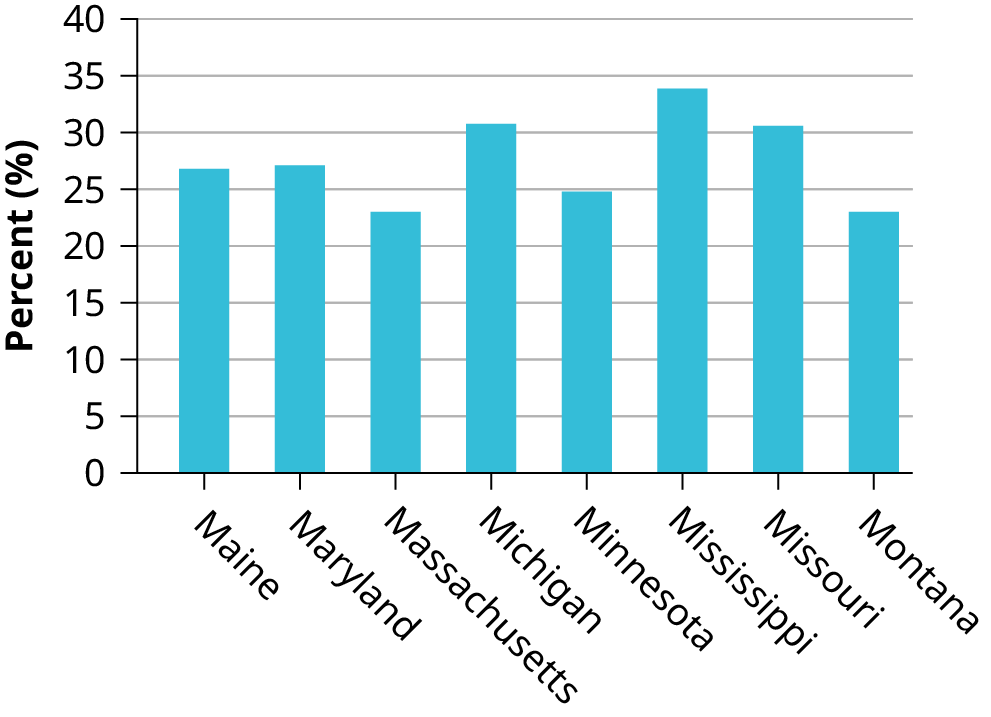
- Construct a bar graph for all the states beginning with the letter "M."名前がMで始まる州すべてについて、棒グラフを作成せよ。
Solution解き方
- Example solution for using the random number generator for the TI-84+ to generate a simple random sample of 8 states. Instructions are as follows.TI-84+の乱数発生器を使い、8州の単純無作為標本を作る解答例。手順は以下のとおりである。
- Number the entries in the table 1–51 (Includes Washington, DC; Numbered vertically)表の項目に1~51の番号を付ける(ワシントンDCを含め、縦方向に番号を付ける)。
- Press MATHMATHを押す。
- Arrow over to PRB矢印キーでPRBへ移動する。
- Press 5:randInt(5:randInt(を選ぶ。
- Enter 51,1,8)51,1,8)と入力する。
Eight numbers are generated (use the right arrow key to scroll through the numbers). The numbers correspond to the numbered states (for this example: {47 21 9 23 51 13 25 4}. If any numbers are repeated, generate a different number by using 5:randInt(51,1)). Here, the states (and Washington DC) are {Arkansas, Washington DC, Idaho, Maryland, Michigan, Mississippi, Virginia, Wyoming}.8個の数が生成される(右矢印キーで数値をスクロールする)。これらは番号を付けた州に対応する。この例では{47 21 9 23 51 13 25 4}となる。重複する数があれば、5:randInt(51,1)で別の数を生成する。ここでの州(およびワシントンDC)は、{アーカンソー、ワシントンDC、アイダホ、メリーランド、ミシガン、ミシシッピ、ヴァージニア、ワイオミング}である。Corresponding percents are {30.1, 22.2, 26.5, 27.1, 30.9, 34.0, 26.0, 25.1}.対応する百分率は{30.1, 22.2, 26.5, 27.1, 30.9, 34.0, 26.0, 25.1}である。Figure 2.9図 2.9 - Figure 2.10図 2.10
- Figure 2.11図 2.11