第2章記述統計
Bringing It Together総合問題
Exercises 59練習問題 59
Exercise 59問題 59
A certain small town in the United states has a population of 27,873 people. Their ages are as follows:
米国のある小さな町には27,873人が住む。年齢は次のとおりである。
Age Group 年齢層 |
Percent of Community 町の人口に占める百分率 |
|---|---|
0–17 |
18.9 |
18–24 |
8.0 |
25–34 |
22.8 |
35–44 |
15.0 |
45–54 |
13.1 |
55–64 |
11.9 |
65+ |
10.3 |
- Construct a histogram of the age distribution for this small town. The bars will not be the same width for this example. Why not? What impact does this have on the reliability of the graph?この町の年齢分布のヒストグラムを作成せよ。この例では棒の幅は同じにならない。なぜか。グラフの信頼性にどう影響するか。
- What percentage of the community is under age 35?町の人口の何%が35歳未満か。
- Which box plot most resembles the information above?上の情報に最も近い箱ひげ図はどれか。
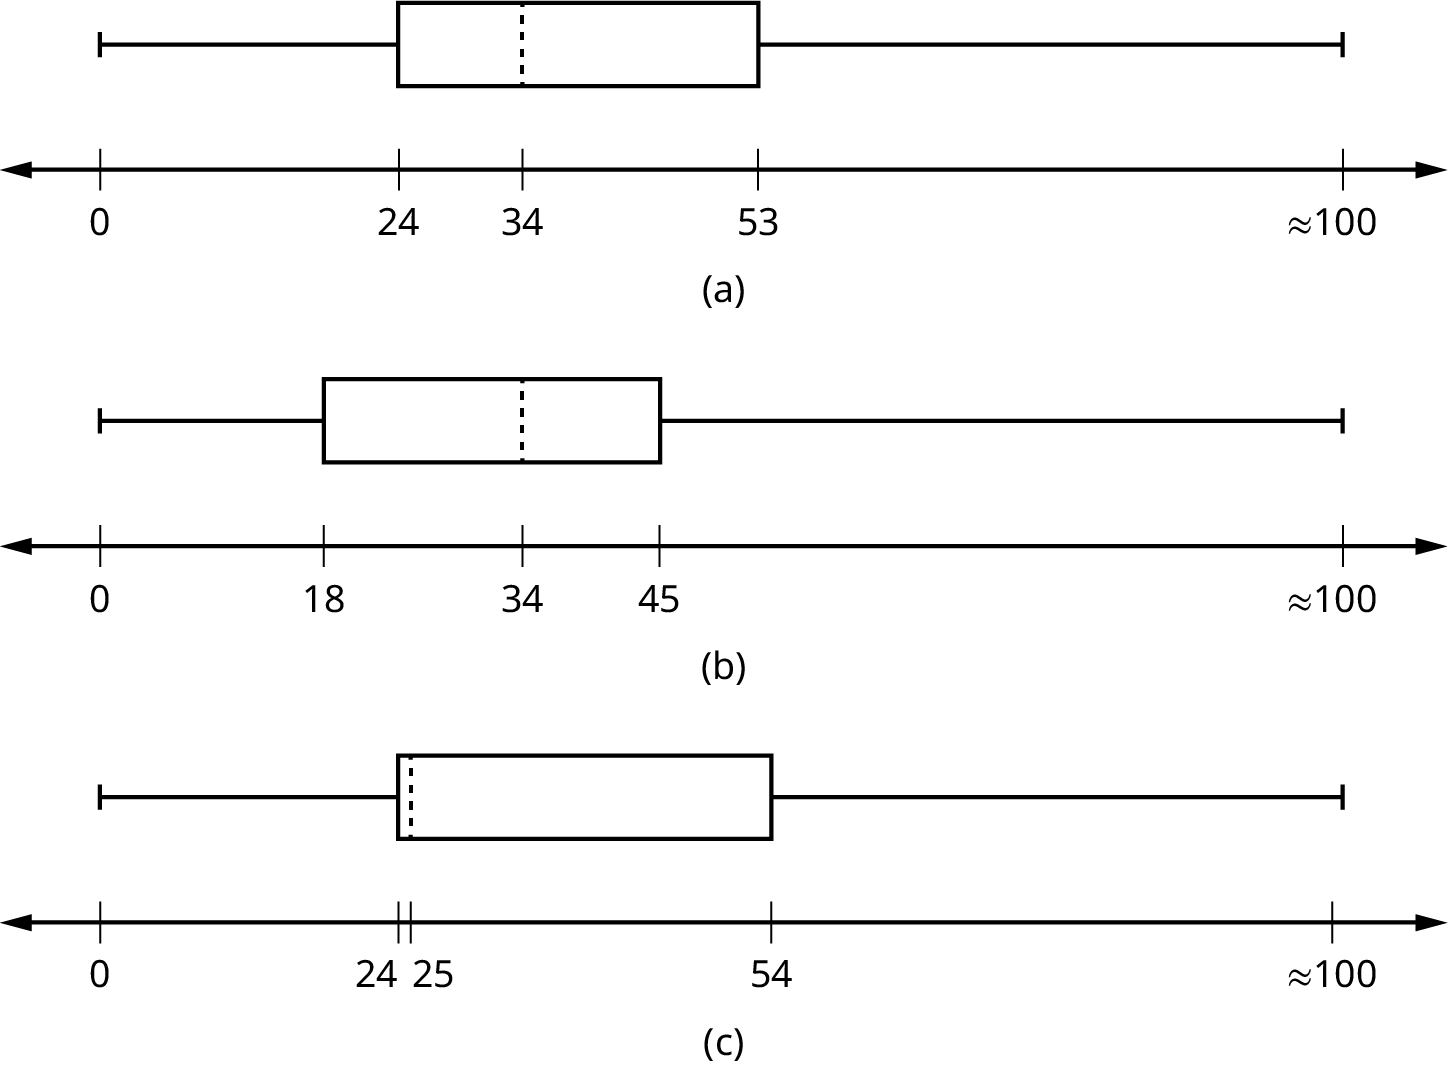

Figure 2.36図 2.36
Solution解き方
- For graph, answers may vary.グラフの答えはさまざまである。
- 49.7% of the community is under the age of 35.町の人口の49.7%が35歳未満である。
- Based on the information in the table, graph (a) most closely represents the data.表の情報に基づくと、図(a)がデータを最もよく表している。
Box plot
箱ひげ図
a graph that gives a quick picture of the middle 50% of the data
データの中央50%の様子をすばやくつかめるグラフ。
First Quartile
第1四分位数
the value that is the median of the of the lower half of the ordered data set
順序に並べたデータの、下半分の中央値。
Frequency Polygon
度数折れ線
looks like a line graph but uses intervals to display ranges of large amounts of data
折れ線グラフに似るが、区間を使って大量のデータの範囲を表すもの。
Interval
区間
also called a class interval; an interval represents a range of data and is used when displaying large data sets
階級区間ともいう。データの範囲を表し、大きなデータセットの表示に用いる。
Paired Data Set
対になったデータセット
two data sets that have a one to one relationship so that:
次のような1対1の対応関係を持つ、2つのデータセット。
- both data sets are the same size, and両方のデータセットの大きさが同じである。
- each data point in one data set is matched with exactly one point from the other set.一方の各データの点が、他方のちょうど1つの点に対応する。
Skewed
歪んだ分布
used to describe data that is not symmetrical; when the right side of a graph looks “chopped off” compared the left side, we say it is “skewed to the left.” When the left side of the graph looks “chopped off” compared to the right side, we say the data is “skewed to the right.” Alternatively: when the lower values of the data are more spread out, we say the data are skewed to the left. When the greater values are more spread out, the data are skewed to the right.
対称でないデータを表す言葉。グラフの右側が左側に比べて「切り落とされた」ように見える場合、「左に歪んでいる」という。左側が右側に比べて「切り落とされた」ように見える場合は、「右に歪んでいる」という。別の言い方では、小さい値の側に広く散らばっていれば左に歪み、大きい値の側に広く散らばっていれば右に歪む。