第2章記述統計
References参考文献
Data from West Magazine.
データ出典:West誌。
Chapter Review章の復習
Box plots are a type of graph that can help visually organize data. To graph a box plot the following data points must be calculated: the minimum value, the first quartile, the median, the third quartile, and the maximum value. Once the box plot is graphed, you can display and compare distributions of data.
箱ひげ図は、データを視覚的に整理するのに役立つグラフの一種である。最小値、第1四分位数、中央値、第3四分位数、最大値を計算して作成する。作成後は、データの分布を示したり比較したりできる。
Exercises 52–53練習問題 52–53
Use the following information to answer the next two exercises. Sixty-five randomly selected car salespersons were asked the number of cars they generally sell in one week. Fourteen people answered that they generally sell three cars; nineteen generally sell four cars; twelve generally sell five cars; nine generally sell six cars; eleven generally sell seven cars.
次の情報で、続く2問に答えよ。無作為に選んだ自動車販売員65人に、通常1週間で何台売るか尋ねた。14人は3台、19人は4台、12人は5台、9人は6台、11人は7台と答えた。
Exercise 52問題 52
Construct a box plot below. Use a ruler to measure and scale accurately.
下に箱ひげ図を作成せよ。定規を使って正確に測り、尺度を設定せよ。
Exercise 53問題 53
Looking at your box plot, does it appear that the data are concentrated together, spread out evenly, or concentrated in some areas, but not in others? How can you tell?
作成した箱ひげ図を見ると、データは一か所に集中しているか、均等に散らばっているか、一部に集中しほかでは少ないか。どうして分かるか。
Solution解き方
More than 25% of salespersons sell four cars in a typical week. You can see this concentration in the box plot because the first quartile is equal to the median. The top 25% and the bottom 25% are spread out evenly; the whiskers have the same length.
販売員の25%を超える人が、通常の週に4台を売る。第1四分位数と中央値が等しいことから、この集中が箱ひげ図に現れる。上位25%と下位25%は均等に散らばっており、ひげの長さは同じである。
Homework宿題
Exercises 54–58練習問題 54–58
Exercise 54問題 54
In a survey of 20-year-olds in China, Germany, and the United States, people were asked the number of foreign countries they had visited in their lifetime. The following box plots display the results.
中国、ドイツ、米国の20歳の人々に、これまで訪れた外国の数を尋ねた。結果を次の箱ひげ図に示す。
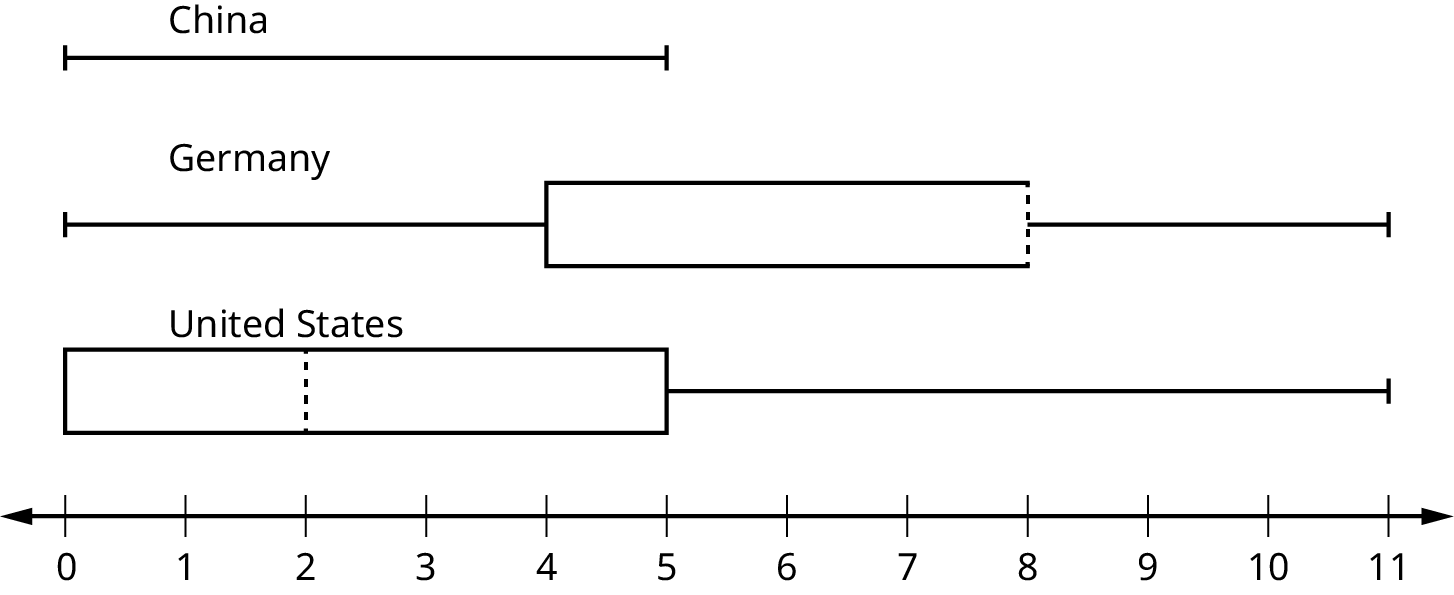
Figure 2.32図 2.32
- In complete sentences, describe what the shape of each box plot implies about the distribution of the data collected.各箱ひげ図の形から、集めたデータの分布について何が分かるか、完全な文で説明せよ。
- Have more U.S. citizens or more Germans surveyed been to over eight foreign countries?調査対象者のうち、外国を8か国より多く訪れた人は、米国人とドイツ人のどちらに多いか。
- Compare the three box plots. What do they imply about the foreign travel of 20-year-old residents of the three countries when compared to each other?3つの箱ひげ図を比較せよ。3か国の20歳の住民の外国旅行について、相互の比較から何が分かるか。
Exercise 55問題 55
Given the following box plot, answer the questions.
次の箱ひげ図を使って、問いに答えよ。

Figure 2.33図 2.33
- Think of an example (in words) where the data might fit into the above box plot. In 2–5 sentences, write down the example.上の箱ひげ図に当てはまりそうなデータの例を考え、2~5文で述べよ。
- What does it mean to have the first and second quartiles so close together, while the second to third quartiles are far apart?第1、第2四分位数が非常に近く、第2、第3四分位数が離れていることは、何を意味するか。
Solution解き方
- Answers will vary. Possible answer: State University conducted a survey to see how involved its students are in community service. The box plot shows the number of community service hours logged by participants over the past year.答えはさまざまである。解答例:州立大学が、学生の地域奉仕活動への参加状況を調査した。箱ひげ図は、参加者が過去1年間に記録した地域奉仕の時間を示す。
- Because the first and second quartiles are close, the data in this quarter is very similar. There is not much variation in the values. The data in the third quarter is much more variable, or spread out. This is clear because the second quartile is so far away from the third quartile.第1、第2四分位数が近いので、その区間のデータはよく似ており、値の変動が小さい。第3の区間は、はるかにばらつきが大きい。第2、第3四分位数が大きく離れていることから分かる。
Exercise 56問題 56
Given the following box plots, answer the questions.
次の箱ひげ図を使って、問いに答えよ。
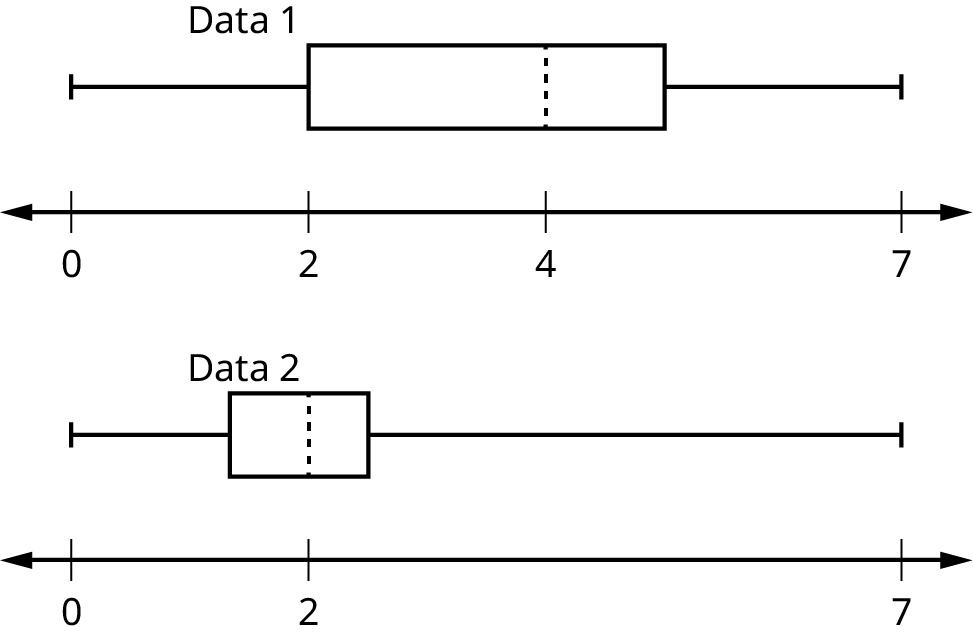
Figure 2.34図 2.34
- In complete sentences, explain why each statement is false.各記述が誤りである理由を、完全な文で説明せよ。
- Data 1 has more data values above two than Data 2 has above two.2より大きいデータの個数は、データ1の方がデータ2より多い。
- The data sets cannot have the same mode.2つのデータセットの最頻値が同じになることはない。
- For Data 1, there are more data values below four than there are above four.データ1では、4未満の値の個数が4より大きい値の個数より多い。
- For which group, Data 1 or Data 2, is the value of “7” more likely to be an outlier? Explain why in complete sentences.「7」が外れ値になりやすいのは、データ1とデータ2のどちらか。理由を完全な文で説明せよ。
Exercise 57問題 57
A survey was conducted of 130 purchasers of new BMW 3 series cars, 130 purchasers of new BMW 5 series cars, and 130 purchasers of new BMW 7 series cars. In it, people were asked the age they were when they purchased their car. The following box plots display the results.
BMWの新車購入者について、3シリーズ、5シリーズ、7シリーズ各130人を調査し、購入時の年齢を尋ねた。結果を次の箱ひげ図に示す。
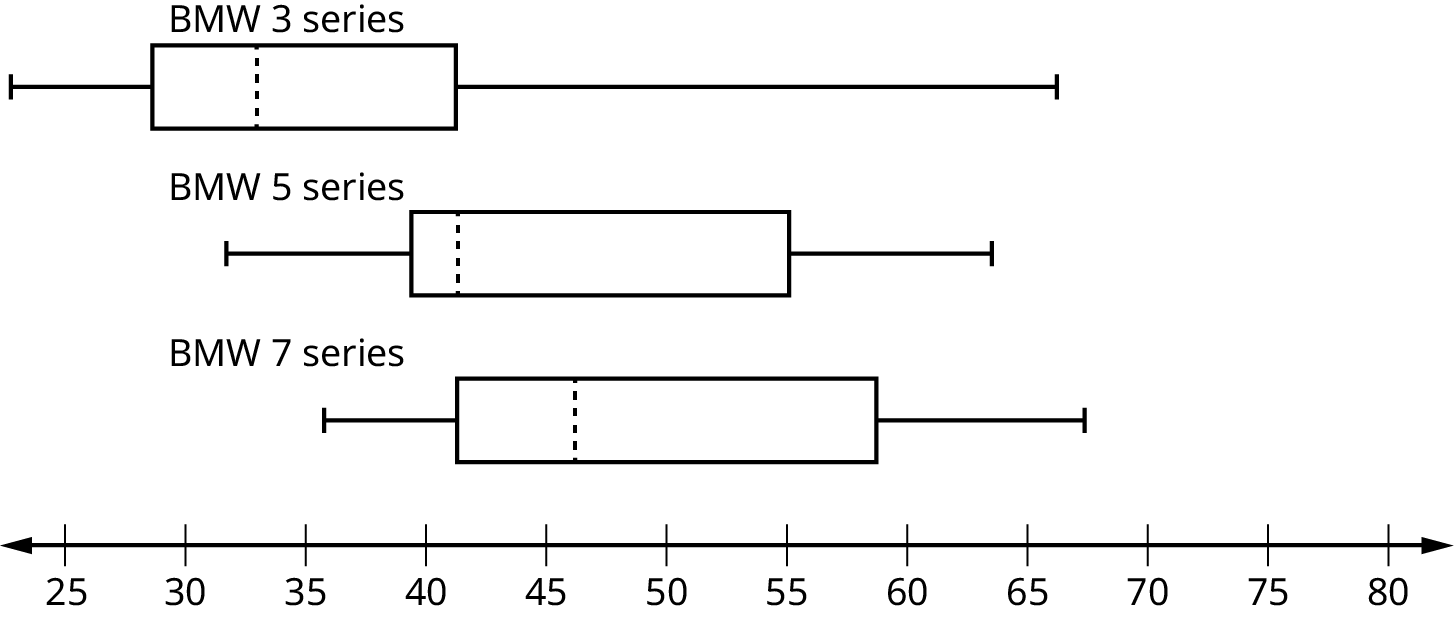


Figure 2.35図 2.35
- In complete sentences, describe what the shape of each box plot implies about the distribution of the data collected for that car series.各箱ひげ図の形が、そのシリーズの購入者データの分布について何を示すか、完全な文で述べよ。
- Which group is most likely to have an outlier? Explain how you determined that.外れ値が最もありそうなのはどの群か。判断の仕方を説明せよ。
- Compare the three box plots. What do they imply about the age of purchasing a BMW from the series when compared to each other?3つの箱ひげ図を比較せよ。各シリーズの購入時の年齢について、相互の比較から何が分かるか。
- Look at the BMW 5 series. Which quarter has the smallest spread of data? What is the spread?BMW5を見よ。4分割された区間のうち、散らばりが最も小さいのはどこか。その幅はいくつか。
- Look at the BMW 5 series. Which quarter has the largest spread of data? What is the spread?BMW5を見よ。4分割された区間のうち、散らばりが最も大きいのはどこか。その幅はいくつか。
- Look at the BMW 5 series. Estimate the interquartile range (IQR).BMW5を見て、四分位範囲(IQR)を推定せよ。
- Look at the BMW 5 series. Are there more data in the interval 31 to 38 or in the interval 45 to 55? How do you know this?BMW5では、31~38と45~55のどちらの区間にデータが多いか。どうして分かるか。
- Look at the BMW 5 series. Which interval has the fewest data in it? How do you know this?BMW5では、データが最も少ない区間はどれか。どうして分かるか。
- 31–35
- 38–41
- 41–64
Solution解き方
- Each box plot is spread out more in the greater values. Each plot is skewed to the right, so the ages of the top 50% of buyers are more variable than the ages of the lower 50%.各箱ひげ図は大きい値の側で広がっている。どれも右に歪んでおり、年齢が上位50%の購入者の方が、下位50%より年齢のばらつきが大きい。
- The BMW 3 series is most likely to have an outlier. It has the longest whisker.BMW3が最も外れ値を含みそうである。ひげが最も長いからである。
- Comparing the median ages, younger people tend to buy the BMW 3 series, while older people tend to buy the BMW 7 series. However, this is not a rule, because there is so much variability in each data set.年齢中央値を比較すると、若い人はBMW3、年上の人はBMW7を買う傾向がある。しかし、各データセットのばらつきが大きいため、決まりきった傾向ではない。
- The second quarter has the smallest spread. There seems to be only a three-year difference between the first quartile and the median.第2区間の散らばりが最小である。第1四分位数と中央値の差は3歳だけに見える。
- The third quarter has the largest spread. There seems to be approximately a 14-year difference between the median and the third quartile.第3区間の散らばりが最大である。中央値と第3四分位数には約14歳の差があるように見える。
- IQR ~ 17 yearsIQRは約17歳
- There is not enough information to tell. Each interval lies within a quarter, so we cannot tell exactly where the data in that quarter is concentrated.判断する情報が足りない。どちらの区間も、4分割された区間の内部なので、その中のどこにデータが集中するかは正確には分からない。
- The interval from 31 to 35 years has the fewest data values. Twenty-five percent of the values fall in the interval 38 to 41, and 25% fall between 41 and 64. Since 25% of values fall between 31 and 38, we know that fewer than 25% fall between 31 and 35.31~35歳の区間のデータが最も少ない。値の25%は38~41、25%は41~64に入る。31~38に25%が入るため、31~35には25%未満が入ると分かる。
Exercise 58問題 58
Twenty-five randomly selected students were asked the number of movies they watched the previous week. The results are as follows:
無作為に選んだ学生25人に、前の週に見た映画の本数を尋ねた。結果は次のとおりである。
# of movies 映画の本数 |
Frequency 度数 |
|---|---|
0 |
5 |
1 |
9 |
2 |
6 |
3 |
4 |
4 |
1 |
Construct a box plot of the data.
データの箱ひげ図を作成せよ。