第6章正規分布
6.1 The Standard Normal Distribution6.1 標準正規分布
The standard normal distribution is a normal distribution of standardized values called z-scores. A z-score is measured in units of the standard deviation. For example, if the mean of a normal distribution is five and the standard deviation is two, the value 11 is three standard deviations above (or to the right of) the mean. The calculation is as follows:
標準正規分布は、zスコアと呼ばれる標準化した値の正規分布である。zスコアは標準偏差を単位として測る。たとえば、正規分布の平均が5、標準偏差が2なら、値11は平均より標準偏差3つ分だけ上(または右)にある。計算は次のようになる。
x = μ + (z)(σ) = 5 + (3)(2) = 11
The z-score is three.
zスコアは3である。
The mean for the standard normal distribution is zero, and the standard deviation is one. The transformation z = produces the distribution Z ~ N(0, 1). The value x in the given equation comes from a normal distribution with mean μ and standard deviation σ.
標準正規分布の平均は0、標準偏差は1である。変換z = によって、分布Z ~ N(0, 1)が得られる。この式のxは、平均μ、標準偏差σの正規分布から得られた値である。
Z-Scoreszスコア
If X is a normally distributed random variable and X ~ N(μ, σ), then the z-score is:
Xが正規分布に従う確率変数で、X ~ N(μ, σ)であるとき、zスコアは次の式で与えられる。
The z-score tells you how many standard deviations the value x is above (to the right of) or below (to the left of) the mean, μ. Values of x that are larger than the mean have positive z-scores, and values of x that are smaller than the mean have negative z-scores. If x equals the mean, then x has a z-score of zero.
zスコアは、値xが平均μより標準偏差いくつ分だけ上(右)または下(左)にあるかを示す。平均より大きいxのzスコアは正、平均より小さいxのzスコアは負となる。xが平均と等しいとき、zスコアは0である。
Example 6.1例題 6.1
Suppose X ~ N(5, 6). This says that X is a normally distributed random variable with mean μ = 5 and standard deviation σ = 6. Suppose x = 17. Then:
X ~ N(5, 6)とする。これは、Xが平均μ = 5、標準偏差σ = 6の正規分布に従う確率変数であることを表す。x = 17とすると、次のようになる。
This means that x = 17 is two standard deviations (2σ) above or to the right of the mean μ = 5.
x = 17は、平均μ = 5より標準偏差2つ分(2σ)だけ上、または右にあることになる。
Notice that: 5 + (2)(6) = 17 (The pattern is μ + zσ = x)
5 + (2)(6) = 17となることに注意しよう。一般的な形はμ + zσ = xである。
Now suppose x = 1. Then: z = = = –0.67 (rounded to two decimal places)
今度はx = 1とする。このとき、z = = = –0.67(小数第2位までに丸めた値)となる。
This means that x = 1 is 0.67 standard deviations (–0.67σ) below or to the left of the mean μ = 5. Notice that: 5 + (–0.67)(6) is approximately equal to one (This has the pattern μ + (–0.67)σ = 1)
x = 1は、平均μ = 5より標準偏差0.67個分(–0.67σ)だけ下、または左にある。5 + (–0.67)(6)がほぼ1になることに注意しよう。これはμ + (–0.67)σ = 1という形である。
Summarizing, when z is positive, x is above or to the right of μ and when z is negative, x is to the left of or below μ. Or, when z is positive, x is greater than μ, and when z is negative x is less than μ.
まとめると、zが正ならxはμより上または右、zが負ならxはμより左または下にある。言い換えると、zが正ならxはμより大きく、zが負ならxはμより小さい。
Example 6.2例題 6.2
Some doctors believe that a person can lose five pounds, on the average, in a month by reducing their fat intake and by exercising consistently. Suppose weight loss has a normal distribution. Let X = the amount of weight lost (in pounds) by a person in a month. Use a standard deviation of two pounds. X ~ N(5, 2). Fill in the blanks.
英語のヒント
脂肪の摂取量を減らして継続的に運動すれば、1か月で平均5ポンド減量できると考える医師もいる。減量は正規分布に従うとする。X = ある人が1か月で減らした体重(ポンド)とする。標準偏差を2ポンドとし、X ~ N(5, 2)とする。空欄を埋めよ。
a. Suppose a person lost ten pounds in a month. The z-score when x = 10 pounds is z = 2.5 (verify). This z-score tells you that x = 10 is ________ standard deviations to the ________ (right or left) of the mean _____ (What is the mean?).
a. ある人が1か月で10ポンド減量したとする。x = 10ポンドのとき、zスコアはz = 2.5である(確かめよ)。このzスコアは、x = 10が平均_____(平均はいくつか)の________(右または左)に、標準偏差________個分だけ離れていることを示す。
Solution解き方
a. This z-score tells you that x = 10 is 2.5 standard deviations to the right of the mean five.
a. x = 10は、平均5より標準偏差2.5個分だけ右にあることを示す。
b. Suppose a person gained three pounds (a negative weight loss). Then z = __________. This z-score tells you that x = –3 is ________ standard deviations to the __________ (right or left) of the mean.
b. ある人の体重が3ポンド増えた(減量が負になった)とする。このときz = __________である。このzスコアは、x = –3が平均の__________(右または左)に、標準偏差________個分だけ離れていることを示す。
Solution解き方
b. z = –4. This z-score tells you that x = –3 is four standard deviations to the left of the mean.
b. z = –4。x = –3は、平均より標準偏差4つ分だけ左にあることを示す。
c. Suppose the random variables X and Y have the following normal distributions: X ~ N(5, 6) and Y ~ N(2, 1). If x = 17, then z = 2. (This was previously shown.) If y = 4, what is z?
c. 確率変数XとYが、それぞれX ~ N(5, 6)、Y ~ N(2, 1)という正規分布に従うとする。x = 17ならz = 2となる(前に示した)。y = 4ならzはいくつか。
Solution解き方
c. z = = = 2 where µ = 2 and σ = 1.
c. μ = 2、σ = 1なので、z = = = 2となる。
The z-score for y = 4 is z = 2. This means that four is z = 2 standard deviations to the right of the mean. Therefore, x = 17 and y = 4 are both two (of their own) standard deviations to the right of their respective means.
英語のヒント
y = 4のzスコアはz = 2である。つまり4は、平均より標準偏差z = 2個分だけ右にある。したがって、x = 17とy = 4は、どちらもそれぞれの平均より、それぞれの標準偏差2つ分だけ右にある。
The z-score allows us to compare data that are scaled differently. To understand the concept, suppose X ~ N(5, 6) represents weight gains for one group of people who are trying to gain weight in a six week period and Y ~ N(2, 1) measures the same weight gain for a second group of people. A negative weight gain would be a weight loss. Since x = 17 and y = 4 are each two standard deviations to the right of their means, they represent the same, standardized weight gain relative to their means.
英語のヒント
zスコアを使うと、尺度の異なるデータを比較できる。この考えを理解するため、6週間で体重を増やそうとしているある集団の体重増加をX ~ N(5, 6)で表し、別の集団の同じ体重増加をY ~ N(2, 1)で測るとする。負の体重増加は減量を意味する。x = 17とy = 4はどちらも、それぞれの平均より標準偏差2つ分だけ右にある。したがって、平均を基準に標準化した体重増加は同じである。
The Empirical Rule経験則
If X is a random variable and has a normal distribution with mean µ and standard deviation σ, then the Empirical Rule states the following:
確率変数Xが平均μ、標準偏差σの正規分布に従うとき、経験則により次が成り立つ。
- About 68% of the x values lie between –1σ and +1σ of the mean µ (within one standard deviation of the mean).xの値の約68%が、平均μから–1σ〜+1σの範囲(平均から標準偏差1つ分以内)に入る。
- About 95% of the x values lie between –2σ and +2σ of the mean µ (within two standard deviations of the mean).xの値の約95%が、平均μから–2σ〜+2σの範囲(平均から標準偏差2つ分以内)に入る。
- About 99.7% of the x values lie between –3σ and +3σ of the mean µ (within three standard deviations of the mean). Notice that almost all the x values lie within three standard deviations of the mean.xの値の約99.7%が、平均μから–3σ〜+3σの範囲(平均から標準偏差3つ分以内)に入る。ほぼすべてのxの値が、平均から標準偏差3つ分以内に入ることに注意しよう。
- The z-scores for +1σ and –1σ are +1 and –1, respectively.+1σと–1σのzスコアは、それぞれ+1と–1である。
- The z-scores for +2σ and –2σ are +2 and –2, respectively.+2σと–2σのzスコアは、それぞれ+2と–2である。
- The z-scores for +3σ and –3σ are +3 and –3 respectively.+3σと–3σのzスコアは、それぞれ+3と–3である。
The empirical rule is also known as the 68-95-99.7 rule.
経験則は、68-95-99.7則とも呼ばれる。
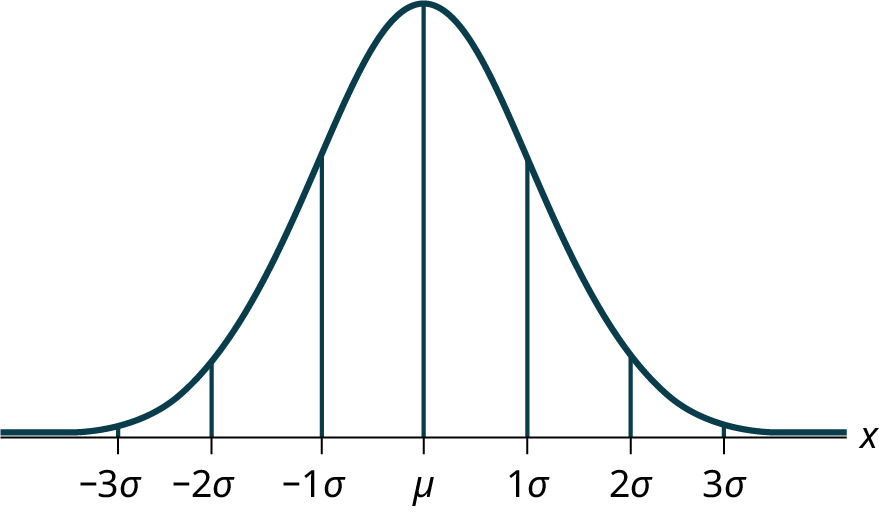

Figure 6.3図 6.3
Example 6.3例題 6.3
The mean height of 15 to 18-year-old males from Chile from 2009 to 2010 was 170 cm with a standard deviation of 6.28 cm. Male heights are known to follow a normal distribution. Let X = the height of a 15 to 18-year-old male from Chile in 2009 to 2010. Then X ~ N(170, 6.28).
2009〜2010年のチリの15〜18歳男性の平均身長は170 cm、標準偏差は6.28 cmだった。男性の身長は正規分布に従うことがわかっている。X = 2009〜2010年のチリの15〜18歳男性の身長とすると、X ~ N(170, 6.28)となる。
a. Suppose a 15 to 18-year-old male from Chile was 168 cm tall from 2009 to 2010. The z-score when x = 168 cm is z = _______. This z-score tells you that x = 168 is ________ standard deviations to the ________ (right or left) of the mean _____ (What is the mean?).
a. 2009〜2010年のチリの15〜18歳のある男性の身長が168 cmだったとする。x = 168 cmのとき、zスコアはz = _______である。これは、x = 168が平均_____(平均はいくつか)の________(右または左)に、標準偏差________個分だけ離れていることを示す。
b. Suppose that the height of a 15 to 18-year-old male from Chile from 2009 to 2010 has a z-score of z = 1.27. What is the male’s height? The z-score (z = 1.27) tells you that the male’s height is ________ standard deviations to the __________ (right or left) of the mean.
b. 2009〜2010年のチリの15〜18歳のある男性の身長のzスコアがz = 1.27であるとする。その男性の身長はいくつか。このzスコア(z = 1.27)は、男性の身長が平均の__________(右または左)に、標準偏差________個分だけ離れていることを示す。
Solution解き方
a. –0.32, 0.32, left, 170
a. –0.32、0.32、左、170。
b. 177.98 cm, 1.27, right
b. 177.98 cm、1.27、右。
Example 6.4例題 6.4
From 1984 to 1985, the mean height of 15 to 18-year-old males from Chile was 172.36 cm, and the standard deviation was 6.34 cm. Let Y = the height of 15 to 18-year-old males from 1984 to 1985. Then Y ~ N(172.36, 6.34).
1984〜1985年のチリの15〜18歳男性の平均身長は172.36 cm、標準偏差は6.34 cmだった。Y = 1984〜1985年の15〜18歳男性の身長とすると、Y ~ N(172.36, 6.34)となる。
The mean height of 15 to 18-year-old males from Chile from 2009 to 2010 was 170 cm with a standard deviation of 6.28 cm. Male heights are known to follow a normal distribution. Let X = the height of a 15 to 18-year-old male from Chile in 2009 to 2010. Then X ~ N(170, 6.28).
2009〜2010年のチリの15〜18歳男性の平均身長は170 cm、標準偏差は6.28 cmだった。男性の身長は正規分布に従うことがわかっている。X = 2009〜2010年のチリの15〜18歳男性の身長とすると、X ~ N(170, 6.28)となる。
Find the z-scores for x = 160.58 cm and y = 162.85 cm. Interpret each z-score. What can you say about x = 160.58 cm and y = 162.85 cm as they compare to their respective means and standard deviations?
x = 160.58 cmとy = 162.85 cmのzスコアを求め、それぞれの意味を説明せよ。それぞれの平均と標準偏差に照らして、x = 160.58 cmとy = 162.85 cmについて何がいえるか。
Solution解き方
The z-score for x = -160.58 is z = –1.5.
The z-score for y = 162.85 is z = –1.5.
Both x = 160.58 and y = 162.85 deviate the same number of standard deviations from their respective means and in the same direction.
The z-score for y = 162.85 is z = –1.5.
Both x = 160.58 and y = 162.85 deviate the same number of standard deviations from their respective means and in the same direction.
英語のヒント
x = –160.58のzスコアはz = –1.5である。y = 162.85のzスコアもz = –1.5である。x = 160.58とy = 162.85は、それぞれの平均から、標準偏差の同じ個数分だけ同じ方向に離れている。
Example 6.5例題 6.5
Suppose x has a normal distribution with mean 50 and standard deviation 6.
xが平均50、標準偏差6の正規分布に従うとする。
- About 68% of the x values lie within one standard deviation of the mean. Therefore, about 68% of the x values lie between –1σ = (–1)(6) = –6 and 1σ = (1)(6) = 6 of the mean 50. The values 50 – 6 = 44 and 50 + 6 = 56 are within one standard deviation from the mean 50. The z-scores are –1 and +1 for 44 and 56, respectively.xの値の約68%は、平均から標準偏差1つ分以内に入る。したがって約68%が、平均50から–1σ = (–1)(6) = –6と1σ = (1)(6) = 6の範囲に入る。50 – 6 = 44と50 + 6 = 56は、平均50から標準偏差1つ分以内の値である。44と56のzスコアは、それぞれ–1と+1である。
- About 95% of the x values lie within two standard deviations of the mean. Therefore, about 95% of the x values lie between –2σ = (–2)(6) = –12 and 2σ = (2)(6) = 12. The values 50 – 12 = 38 and 50 + 12 = 62 are within two standard deviations from the mean 50. The z-scores are –2 and +2 for 38 and 62, respectively.xの値の約95%は、平均から標準偏差2つ分以内に入る。したがって約95%が、–2σ = (–2)(6) = –12と2σ = (2)(6) = 12の範囲に入る。50 – 12 = 38と50 + 12 = 62は、平均50から標準偏差2つ分以内の値である。38と62のzスコアは、それぞれ–2と+2である。
- About 99.7% of the x values lie within three standard deviations of the mean. Therefore, about 99.7% of the x values lie between –3σ = (–3)(6) = –18 and 3σ = (3)(6) = 18 from the mean 50. The values 50 – 18 = 32 and 50 + 18 = 68 are within three standard deviations of the mean 50. The z-scores are –3 and +3 for 32 and 68, respectively.xの値の約99.7%は、平均から標準偏差3つ分以内に入る。したがって約99.7%が、平均50から–3σ = (–3)(6) = –18と3σ = (3)(6) = 18の範囲に入る。50 – 18 = 32と50 + 18 = 68は、平均50から標準偏差3つ分以内の値である。32と68のzスコアは、それぞれ–3と+3である。
Example 6.6例題 6.6
From 1984 to 1985, the mean height of 15 to 18-year-old males from Chile was 172.36 cm, and the standard deviation was 6.34 cm. Let Y = the height of 15 to 18-year-old males in 1984 to 1985. Then Y ~ N(172.36, 6.34).
1984〜1985年のチリの15〜18歳男性の平均身長は172.36 cm、標準偏差は6.34 cmだった。Y = 1984〜1985年の15〜18歳男性の身長とすると、Y ~ N(172.36, 6.34)となる。
- About 68% of the y values lie between what two values? These values are ________________. The z-scores are ________________, respectively.yの値の約68%は、どの2つの値の間に入るか。その値は________________である。zスコアはそれぞれ________________である。
- About 95% of the y values lie between what two values? These values are ________________. The z-scores are ________________ respectively.yの値の約95%は、どの2つの値の間に入るか。その値は________________である。zスコアはそれぞれ________________である。
- About 99.7% of the y values lie between what two values? These values are ________________. The z-scores are ________________, respectively.yの値の約99.7%は、どの2つの値の間に入るか。その値は________________である。zスコアはそれぞれ________________である。
Solution解き方
- About 68% of the values lie between 166.02 cm and 178.7 cm. The z-scores are –1 and 1.値の約68%は166.02 cmと178.7 cmの間に入る。zスコアは–1と1である。
- About 95% of the values lie between 159.68 cm and 185.04 cm. The z-scores are –2 and 2.値の約95%は159.68 cmと185.04 cmの間に入る。zスコアは–2と2である。
- About 99.7% of the values lie between 153.34 cm and 191.38 cm. The z-scores are –3 and 3.値の約99.7%は153.34 cmと191.38 cmの間に入る。zスコアは–3と3である。