付録
Chapter 11第11章
Use the following information to answer the next four exercises: Suppose that the time that owners keep their cars (purchased new) is normally distributed with a mean of seven years and a standard deviation of two years. We are interested in how long an individual keeps his car (purchased new). Our population is people who buy their cars new.
次の情報を用いて、続く4問に答えよ。新車を購入した所有者がその車を保有する期間は、平均7年、標準偏差2年の正規分布に従うとする。1人が新車で購入した車を何年保有するかに関心がある。母集団は新車を購入する人々である。
100. Sixty percent of individuals keep their cars at most how many years?
100。保有期間が何年以下の人が全体の60%を占めるか。
101. Suppose that we randomly survey one person. Find the probability that person keeps their car less than 2.5 years.
101。1人を無作為に調べるとする。その人の車の保有期間が2.5年未満である確率を求めよ。
102. If we are to pick individuals ten at a time, find the distribution for the mean car length ownership.
102。一度に10人ずつ選ぶ場合、車の平均保有期間の分布を求めよ。
103. If we are to pick ten individuals, find the probability that the sum of their ownership time is more than 55 years.
103。10人を選ぶ場合、その保有期間の合計が55年を超える確率を求めよ。
104. For which distribution is the median not equal to the mean?
104。中央値と平均値が等しくない分布はどれか。
- Uniform一様分布
- Exponential指数分布
- Normal正規分布
- Student tスチューデントの t分布
105. Compare the standard normal distribution to the Student’s t-distribution, centered at zero. Explain which of the following are true and which are false.
105。標準正規分布と、0を中心とするスチューデントの t分布を比較せよ。次のどれが正しく、どれが誤りかを説明せよ。
- As the number surveyed increases, the area to the left of –1 for the Student’s t-distribution approaches the area for the standard normal distribution.調査人数が増えるにつれて、スチューデントの t分布で −1 より左の面積は、標準正規分布での面積に近づく。
- As the degrees of freedom decrease, the graph of the Student’s t-distribution looks more like the graph of the standard normal distribution.自由度が小さくなるにつれて、スチューデントの t分布のグラフは標準正規分布のグラフに近づく。
- If the number surveyed is 15, the normal distribution should never be used.調査人数が15人なら、正規分布を使ってはならない。
Use the following information to answer the next five exercises: We are interested in the checking account balance of twenty-year-old college students. We randomly survey 16 twenty-year-old college students. We obtain a sample mean of $640 and a sample standard deviation of $150. Let X = checking account balance of an individual twenty year old college student.
英語のヒント
次の情報を用いて、続く5問に答えよ。20歳の大学生の当座預金残高に関心がある。20歳の大学生16人を無作為に調べると、標本平均640ドル、標本標準偏差150ドルが得られた。X = 20歳の大学生1人の当座預金残高、とする。
106. Explain why we cannot determine the distribution of X.
106。X の分布を決められない理由を説明せよ。
107. If you were to create a confidence interval or perform a hypothesis test for the population mean checking account balance of twenty-year-old college students, what distribution would you use?
107。20歳の大学生の当座預金残高の母平均について、信頼区間を作る、または仮説検定を行うなら、どの分布を使うか。
108. Find the 95% confidence interval for the true mean checking account balance of a twenty-year-old college student.
108。20歳の大学生の当座預金残高の真の平均について、95%信頼区間を求めよ。
109. What type of data is the balance of the checking account considered to be?
109。当座預金残高はどの種類のデータと考えられるか。
110. What type of data is the number of twenty-year-olds considered to be?
110。20歳の人の人数はどの種類のデータと考えられるか。
111. On average, a busy emergency room gets a patient with a shotgun wound about once per week. We are interested in the number of patients with a shotgun wound the emergency room gets per 28 days.
英語のヒント
111。ある忙しい救急外来には、散弾銃による負傷者が平均して約週1人来院する。28日間に来院する散弾銃による負傷者数に関心がある。
- Define the random variable X.確率変数Xを定義せよ。
- State the distribution for X.X の分布を示せ。
- Find the probability that the emergency room gets no patients with shotgun wounds in the next 28 days.今後28日間に、散弾銃による負傷者が救急外来に1人も来院しない確率を求めよ。
Use the following information to answer the next two exercises: The probability that a certain slot machine will pay back money when a quarter is inserted is 0.30. Assume that each play of the slot machine is independent from each other. A person puts in 15 quarters for 15 plays.
英語のヒント
次の情報を用いて、続く2問に答えよ。あるスロットマシンに25セント硬貨を入れたとき、払い戻しがある確率は0.30である。各回の結果は独立とする。ある人が25セント硬貨を15枚使って15回遊ぶ。
112. Is the expected number of plays of the slot machine that will pay back money greater than, less than or the same as the median? Explain your answer.
112。払い戻しがある回数の期待値は、中央値より大きいか、小さいか、同じか。理由を説明せよ。
113. Is it likely that exactly eight of the 15 plays would pay back money? Justify your answer numerically.
113。15回のうちちょうど8回払い戻しがあるのは、起こりやすいことか。数値を使って根拠を示せ。
114. A game is played with the following rules:
114。次のルールでゲームを行う。
- it costs $10 to enter.参加費は10ドル。
- a fair coin is tossed four times.公平な硬貨を4回投げる。
- if you do not get four heads or four tails, you lose your $10.4回とも表、または4回とも裏にならなければ、10ドルを失う。
- if you get four heads or four tails, you get back your $10, plus $30 more.4回とも表、または4回とも裏なら、10ドルが戻り、さらに30ドルを受け取る。
Over the long run of playing this game, what are your expected earnings?
このゲームを長期間繰り返すとき、収益の期待値はいくらか。
115.
- The mean grade on a math exam in Rachel’s class was 74, with a standard deviation of five. Rachel earned an 80.レイチェルのクラスの数学試験は、平均74点、標準偏差5点だった。レイチェルは80点を取った。
- The mean grade on a math exam in Becca’s class was 47, with a standard deviation of two. Becca earned a 51.ベッカのクラスの数学試験は、平均47点、標準偏差2点だった。ベッカは51点を取った。
- The mean grade on a math exam in Matt’s class was 70, with a standard deviation of eight. Matt earned an 83.マットのクラスの数学試験は、平均70点、標準偏差8点だった。マットは83点を取った。
Find whose score was the best, compared to their own class. Justify your answer numerically.
それぞれ自分のクラスと比較したとき、最もよい成績だったのは誰か。数値を使って根拠を示せ。
Use the following information to answer the next two exercises: A random sample of 70 compulsive gamblers were asked the number of days they go to casinos per week. The results are given in the following graph:
英語のヒント
次の情報を用いて、続く2問に答えよ。ギャンブル依存のある人70人を無作為標本として、週に何日カジノに行くかを尋ねた。結果を次のグラフに示す。
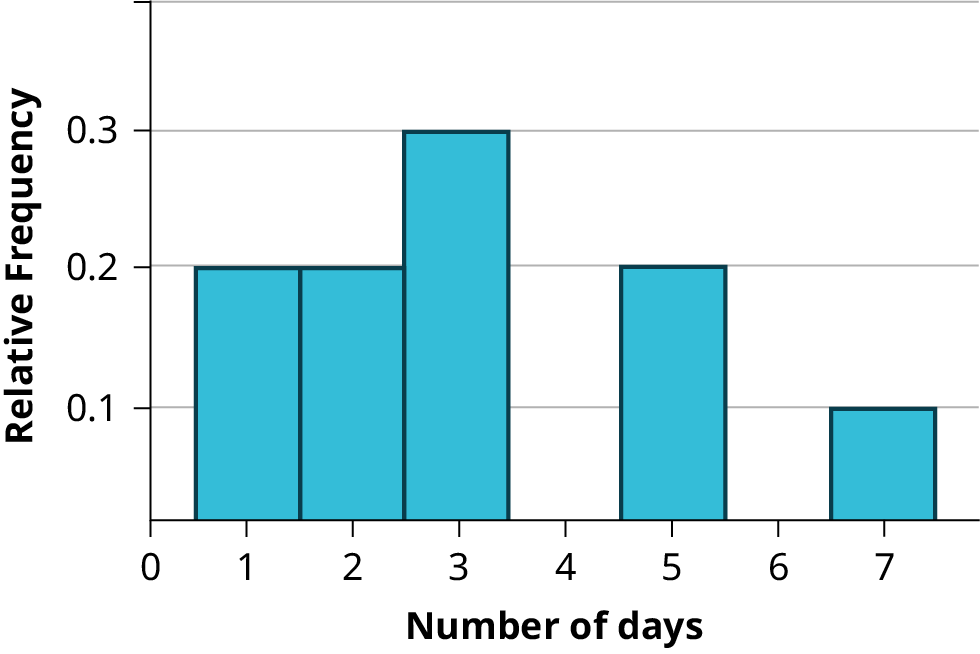

Figure A.5図 A.5
116. Find the number of responses that were five.
116。5日と答えた人数を求めよ。
117. Find the mean, standard deviation, the median, the first quartile, the third quartile and the IQR.
117。平均値、標準偏差、中央値、第1四分位数、第3四分位数、四分位範囲を求めよ。
118. Based upon research at De Anza College, it is believed that about 19% of the student population speaks a language other than English at home. Suppose that a study was done this year to see if that percent has decreased. Ninety-eight students were randomly surveyed with the following results. Fourteen said that they speak a language other than English at home.
118。デアンザ・カレッジでの研究から、学生の約19%が家庭で英語以外の言語を話すと考えられている。今年、この割合が減ったかどうかを調べたとする。学生98人を無作為に調査したところ、14人が家庭で英語以外の言語を話すと回答した。
- State an appropriate null hypothesis.適切な帰無仮説を示せ。
- State an appropriate alternative hypothesis.適切な対立仮説を示せ。
- Define the random variable, P′.確率変数 P′ を定義せよ。
- Calculate the test statistic.検定統計量を計算しよう。
- Calculate the p-value.p値を求める。
- At the 5% level of decision, what is your decision about the null hypothesis?5%の水準で、帰無仮説についてどのように判断するか。
- What is the Type I error?第1種の過誤は何か。
- What is the Type II error?第2種の過誤は何か。
119. Assume that you are an emergency paramedic called in to rescue victims of an accident. You need to help a patient who is bleeding profusely. The patient is also considered to be a high risk for contracting hepatitis. Assume that the null hypothesis is that the patient does not have hepatitis. What is a Type I error?
英語のヒント
119。あなたは事故の被害者を救助するために呼ばれた救急救命士である。大量に出血している患者を助ける必要がある。その患者は、肝炎に感染している危険性も高いと考えられている。帰無仮説を「患者は肝炎にかかっていない」とする。第1種の過誤は何か。
120. It is often said that Californians are more casual than the rest of Americans. Suppose that a survey was done to see if the proportion of Californian professionals that wear jeans to work is greater than the proportion of non-Californian professionals. Fifty of each was surveyed with the following results. Fifteen Californians wear jeans to work and six non-Californians wear jeans to work.
Let C = Californian professional; NC = non-Californian professional
Let C = Californian professional; NC = non-Californian professional
120。カリフォルニアの人々は、ほかの米国人よりくだけているとよく言われる。ジーンズを着て仕事に行く専門職の割合が、カリフォルニア州では州外より高いかを調べたとする。それぞれ50人ずつ調査すると、ジーンズで出勤する人は州内で15人、州外で6人だった。C = カリフォルニア州の専門職、NC = カリフォルニア州外の専門職、とする。
- State appropriate null and alternate hypotheses.適切な帰無仮説と対立仮説を示せ。
- Define the random variable.確率変数を定義せよ。
- Calculate the test statistic and p-value.検定統計量と p値を計算せよ。
- At the 5% significance level, what is your decision?有意水準5%では、どのように判断するか。
- What is the Type I error?第1種の過誤は何か。
- What is the Type II error?第2種の過誤は何か。
Use the following information to answer the next two exercises: A group of Statistics students have developed a technique that they feel will lower their anxiety level on statistics exams. They measured their anxiety level at the start of the quarter and again at the end of the quarter. Recorded is the paired data in that order: (1000, 900); (1200, 1050); (600, 700); (1300, 1100); (1000, 900); (900, 900).
英語のヒント
次の情報を用いて、続く2問に答えよ。統計学を学ぶ学生のグループが、統計学の試験に対する不安を減らせると考える方法を開発した。学期の初めと終わりに、不安の程度を測定した。その順に対応させたデータは、(1000, 900)、(1200, 1050)、(600, 700)、(1300, 1100)、(1000, 900)、(900, 900) である。
121. This is a test of (pick the best answer):
121。これは何の検定か。最適な答えを選べ。
- large samples, independent means大標本、独立な平均
- small samples, independent means小標本、独立な平均
- dependent means対応のある平均
122. State the distribution to use for the test.
122。検定に使う分布を示せ。