付録
2.4: Box Plots2.4:箱ひげ図
38. 5
39. 3
40. 7
41. The median is 86, as represented by the vertical line in the box.
41。中央値は86で、箱の中の縦線がそれを示している。
42. The first quartile is 80, and the third quartile is 92, as represented by the left and right boundaries of the box.
42。第1四分位数は80、第3四分位数は92で、箱の左右の境界がそれを示している。
43. IQR = 92 – 80 = 12
43。四分位範囲 IQR = 92 − 80 = 12。
44. Range = 100 – 75 = 25
44。範囲 = 100 − 75 = 25。
2.5: Measures of the Center of the Data2.5:データの中心の尺度
45. Half the runners who finished the marathon ran a time faster than 3:35:04, and half ran a time slower than 3:35:04. Your time is faster than the median time, so you did better than more than half of the runners in this race.
45。完走者の半数は3:35:04より速く、半数はそれより遅かった。あなたの記録は中央値より速いため、このレースの半数を超える走者よりよい記録だった。
46. 61.5, or $61,500
46。61.5、すなわち61,500ドル。
47. 49.25 or $49,250
47。49.25、すなわち49,250ドル。
48. The median, because the mean is distorted by the high value of one house.
48。中央値である。平均値は、1軒の高額な住宅の影響で歪められるため。
2.6: Skewness and the Mean, Median, and Mode2.6:歪みと平均値・中央値・最頻値
49. c
50. a
51. They will all be fairly close to each other.
51。三つとも互いにかなり近い値になる。
2.7: Measures of the Spread of the Data2.7:データの散らばりの尺度
52. Mean: 15
Standard deviation: 4.3
Standard deviation: 4.3
52。平均値:15。標準偏差:4.3。
53. 15 + (2)(4.3) = 23.6
54. 13.7 is one standard deviation below the mean of this data, because 15 – 4.3 = 10.7
54。15 − 4.3 = 10.7 なので、13.7はこのデータの平均より標準偏差一つ分だけ下にある。
55.
Susan’s z-score was 2.0, meaning she scored two standard deviations above the class mean for the final exam.
Susan’s z-score was 2.0, meaning she scored two standard deviations above the class mean for the final exam.
55。 スーザンの z得点は2.0であり、期末試験の得点がクラスの平均より標準偏差の2倍だけ高かったことを意味する。
3.1: Terminology3.1:用語
56.
57. Drawing a red marble is more likely.
57。赤いビー玉のほうが出やすい。
58. P(F AND S)
58。P(F かつ S)
59. P(E|M)
59。P(E|M)
3.2: Independent and Mutually Exclusive Events3.2:独立な事象と互いに排反な事象
60. P(A AND B) = (0.3)(0.5) = 0.15
60。P(A かつ B) = (0.3)(0.5) = 0.15
61. P(C OR D) = 0.18 + 0.03 = 0.21
61。P(C または D) = 0.18 + 0.03 = 0.21
3.3: Two Basic Rules of Probability3.3:確率の二つの基本法則
62. No, they cannot be mutually exclusive, because they add up to more than 300. Therefore, some students must fit into two or more categories (e.g., both going to college and working full time).
62。いいえ。人数の合計が300を超えるため、互いに排反ではありえない。したがって、2つ以上のカテゴリに当てはまる生徒がいるはずである。たとえば、大学に進学しながらフルタイムでも働く生徒である。
63. P(A and B) = (P(B|A))(P(A)) = (0.85)(0.70) = 0.595
63。P(A かつ B) = (P(B|A))(P(A)) = (0.85)(0.70) = 0.595
64. No. If they were independent, P(B) would be the same as P(B|A). We know this is not the case, because P(B) = 0.70 and P(B|A) = 0.85.
64。いいえ。独立なら P(B) と P(B|A) は等しいはずだが、P(B) = 0.70、P(B|A) = 0.85 であり、一致しない。
3.4: Contingency Tables3.4:分割表
65.
Honor roll 成績優秀者 |
No honor roll 成績優秀者ではない |
Total 合計 |
|
|---|---|---|---|
Study at least 15 hours/week 週15時間以上勉強する |
482 |
200 |
682 |
Study less than 15 hours/week 勉強時間は週15時間未満 |
125 |
193 |
318 |
Total 合計 |
607 |
393 |
1,000 |
66. , or about
66。、すなわち約 。
67. , or
67。、すなわち 。
68. Let P(S) = study at least 15 hours per week
Let P(H) = makes the honor roll
From the table, P(S) = 0.682, P(H) = 0.607, and P(S AND H) =0.482.
If P(S) and P(H) were independent, then P(S AND H) would equal (P(S))(P(H)).
However, (P(S))(P(H)) = (0.682)(0.607) = 0.414, while P(S AND H) = 0.482.
Therefore, P(S) and P(H) are not independent.
Let P(H) = makes the honor roll
From the table, P(S) = 0.682, P(H) = 0.607, and P(S AND H) =0.482.
If P(S) and P(H) were independent, then P(S AND H) would equal (P(S))(P(H)).
However, (P(S))(P(H)) = (0.682)(0.607) = 0.414, while P(S AND H) = 0.482.
Therefore, P(S) and P(H) are not independent.
68。P(S) を週15時間以上勉強する確率、P(H) を成績優秀者名簿に載る確率とする。表より、P(S) = 0.682、P(H) = 0.607、P(S かつ H) = 0.482 である。P(S) と P(H) が独立なら、P(S かつ H) は (P(S))(P(H)) に等しいはずである。しかし、(P(S))(P(H)) = (0.682)(0.607) = 0.414 であるのに対し、P(S かつ H) = 0.482 である。したがって、P(S) と P(H) は独立ではない。
3.5: Tree and Venn Diagrams3.5:樹形図とベン図
69.
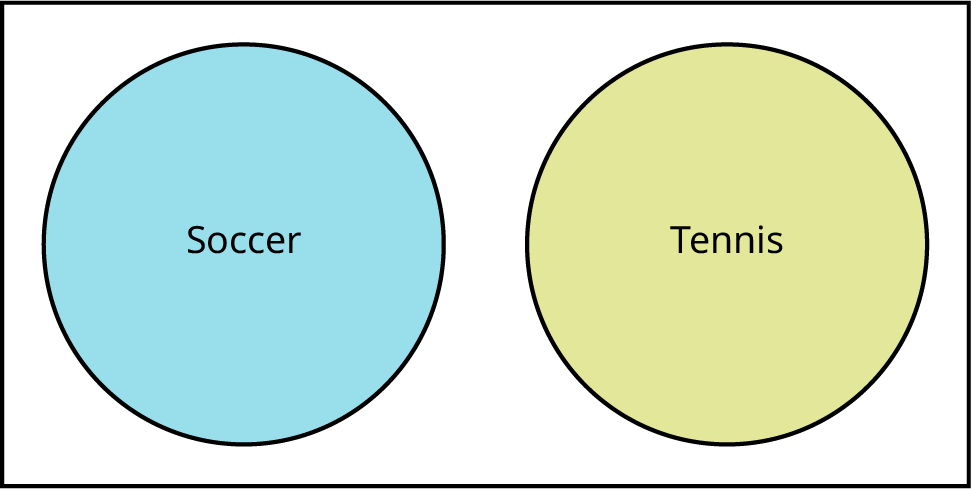
Figure B.2図 B.2
70.
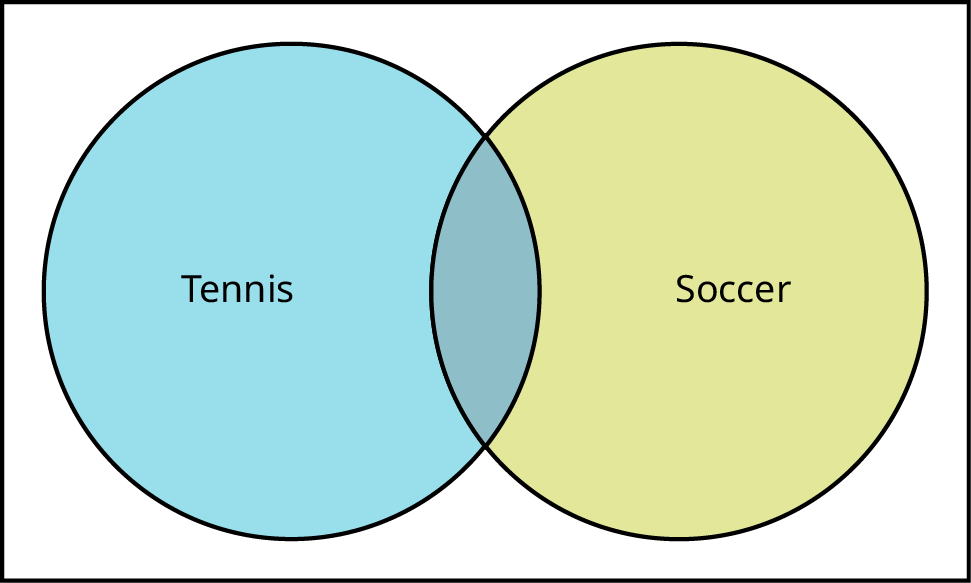


Figure B.3図 B.3
Practice Test 2模擬試験2
4.1: Probability Distribution Function (PDF) for a Discrete Random Variable4.1:離散型確率変数の確率分布関数(PDF)
Use the following information to answer the next five exercises. You conduct a survey among a random sample of students at a particular university. The data collected includes their major, the number of classes they took the previous semester, and amount of money they spent on books purchased for classes in the previous semester.
次の情報を用いて、続く5問に答えよ。ある大学の学生を無作為に抽出して調査を行う。専攻、前学期の履修科目数、前学期に授業用に購入した本の代金を収集する。
1. If X = student’s major, then what is the domain of X?
1。X = 学生の専攻、とすると、X の取りうる値の範囲は何か。
2. If Y = the number of classes taken in the previous semester, what is the domain of Y?
2。Y = 前学期の履修科目数、とすると、Y の取りうる値の範囲は何か。
3. If Z = the amount of money spent on books in the previous semester, what is the domain of Z?
3。Z = 前学期の本の購入額、とすると、Z の取りうる値の範囲は何か。
4. Why are X, Y, and Z in the previous example random variables?
4。前の例の X、Y、Z は、なぜ確率変数なのか。
5. After collecting data, you find that for one case, z = –7. Is this a possible value for Z?
5。データを集めたところ、ある回答で z = −7 となっていた。これは Z が取りうる値か。
6. What are the two essential characteristics of a discrete probability distribution?
6。離散型確率分布に欠かせない二つの性質は何か。
Use this discrete probability distribution represented in this table to answer the following six questions. The university library records the number of books checked out by each patron over the course of one day, with the following result:
英語のヒント
表に示された離散型確率分布を用いて、次の6問に答えよ。大学図書館がある1日に各利用者の借りた本の冊数を記録すると、次の結果が得られた。
x |
P(x) |
|---|---|
0 |
0.20 |
1 |
0.45 |
2 |
0.20 |
3 |
0.10 |
4 |
0.05 |
7. Define the random variable X for this example.
7。この例の確率変数 X を定義せよ。
8. What is P(x > 2)?
8。P(x > 2) はいくつか。
9. What is the probability that a patron will check out at least one book?
9。利用者が少なくとも1冊借りる確率はいくつか。
10. What is the probability a patron will take out no more than three books?
10。利用者が借りる本が3冊以下である確率はいくつか。
11. If the table listed P(x) as 0.15, how would you know that there was a mistake?
11。表に P(x) が0.15と記されていたら、誤りがあるとどうしてわかるか。
12. What is the average number of books taken out by a patron?
12。利用者が借りる本の平均冊数はいくつか。