付録
Chapter 6第6章
Use the following information to answer the next two exercises: X ~ U(3, 13)
次の情報を用いて、続く2問に答えよ。X ~ U(3, 13)。
41. Explain which of the following are false and which are true.
41。次のどれが誤りで、どれが正しいかを説明せよ。
- f(x) = , 3 ≤ x ≤ 13f(x) = 、3 ≤ x ≤ 13。
- There is no mode最頻値は存在しない。
- The median is less than the mean.中央値は平均値より小さい。
- P(x > 10) = P(x ≤ 6)
42. Calculate:
42。次を計算せよ。
- the mean.平均値。
- the median.中央値。
- the 65th percentile.65パーセンタイル。
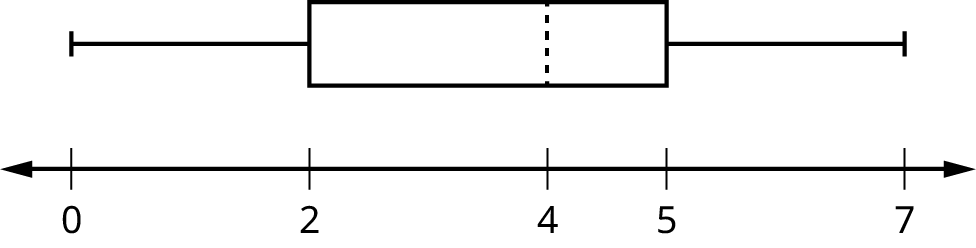

Figure A.4図 A.4
43. Which of the following is true for the box plot in Figure A.4?
43。図A.4の箱ひげ図について、正しい記述はどれか。
- Twenty-five percent of the data are at most five.データの25%が5以下である。
- There is about the same amount of data from 4–5 as there is from 5–7.4~5の範囲と5~7の範囲に、ほぼ同じ数のデータがある。
- There are no data values of three.値が3のデータはない。
- Fifty percent of the data are four.データの50%が4である。
44. If P(G|H) = P(G), then which of the following is correct?
44。P(G|H) = P(G) なら、次のどれが正しいか。
- G and H are mutually exclusive events.G と H は互いに排反な事象である。
- P(G) = P(H)
- Knowing that H has occurred will affect the chance that G will happen.H が起きたとわかると、G が起きる確率は変わる。
- G and H are independent events.G と H は独立な事象である。
45. If P(J) = 0.3, P(K) = 0.63, and J and K are independent events, then explain which are correct and which are incorrect.
45。P(J) = 0.3、P(K) = 0.63 で、J と K は独立な事象である。次のどれが正しく、どれが誤りかを説明せよ。
- P(J AND K) = 0P(J かつ K) = 0
- P(J OR K) = 0.9P(J または K) = 0.9
- P(J OR K) = 0.72P(J または K) = 0.72
- P(J) ≠ P(J|K)
46. On average, five students from each high school class get full scholarships to four-year colleges. Assume that most high school classes have about 500 students. X = the number of students from a high school class that get full scholarships to four-year schools. Which of the following is the distribution of X?
英語のヒント
46。高校の各学年から平均5人が、4年制大学の全額奨学金を受ける。多くの高校は1学年に約500人の生徒がいるとする。X = 高校のある学年で4年制大学の全額奨学金を受ける人数、とする。X の分布は次のどれか。
- P(5)
- B(500, 5)
- Exp
Chapter 7第7章
Use the following information to answer the next three exercises: Richard’s Furniture Company delivers furniture from 10 A.M. to 2 P.M. continuously and uniformly. We are interested in how long (in hours) past the 10 A.M. start time that individuals wait for their delivery.
次の情報を使い、続く3問に答える。リチャード家具会社は、午前10時から午後2時までの間、連続的かつ一様に家具を配達する。配達開始の午前10時から何時間待つと、それぞれの人に家具が届くかを考える。
47. X ~ _________
47。X ~ _________
- U(0, 4)
- U(10, 20)
- Exp(2)
- N(2, 1)
48. The average wait time is:
48。平均待ち時間はどれか。
- 1 hour.1時間。
- 2 hours.2時間。
- 2.5 hours.2.5時間。
- 4 hours.4時間。
49. Suppose that it is now past noon on a delivery day. The probability that a person must wait at least 1.5 more hours is:
49。配達日の正午を過ぎたところだとする。さらに少なくとも1.5時間待たなければならない確率はどれか。
50. Given: X ~ Exp
50。X ~ Exp が与えられている。
- Find P(x > 1).P(x > 1) を求めよ。
- Calculate the minimum value for the upper quartile.上位四分位に入る値の最小値を計算せよ。
- Find PP を求めよ。
51.
- 40% of full-time students took 4 years to graduate全日制学生の40%が卒業に4年かかった。
- 30% of full-time students took 5 years to graduate全日制学生の30%が卒業に5年かかった。
- 20% of full-time students took 6 years to graduate全日制学生の20%が卒業に6年かかった。
- 10% of full-time students took 7 years to graduate全日制学生の10%が卒業に7年かかった。
The expected time for full-time students to graduate is:
全日制学生が卒業するまでの年数の期待値はどれか。
- 4 years4年
- 4.5 years4.5年
- 5 years5年
- 5.5 years5.5年
52. Which of the following distributions is described by the following example?
Many people can run a short distance of under two miles, but as the distance increases, fewer people can run that far.
Many people can run a short distance of under two miles, but as the distance increases, fewer people can run that far.
52。次の例に当てはまる分布はどれか。多くの人は2マイル未満の短い距離を走れるが、距離が長くなるほど、そこまで走れる人は少なくなる。
- binomial二項分布
- uniform一様分布
- exponential指数分布
- normal正規分布
53. The length of time to brush one’s teeth is generally thought to be exponentially distributed with a mean of minutes. Find the probability that a randomly selected person brushes their teeth less than minutes.
53。歯磨きの時間は、平均 分の指数分布に従うと一般に考えられている。無作為に選んだ人の歯磨きの時間が 分未満である確率を求めよ。
- 0.5
- 0.43
- 0.63
54. Which distribution accurately describes the following situation?
The chance that a teenage boy regularly gives his mother a kiss goodnight is about 20%. Fourteen teenage boys are randomly surveyed. Let X = the number of teenage boys that regularly give their mother a kiss goodnight.
The chance that a teenage boy regularly gives his mother a kiss goodnight is about 20%. Fourteen teenage boys are randomly surveyed. Let X = the number of teenage boys that regularly give their mother a kiss goodnight.
54。次の状況を正確に表す分布はどれか。10代の男子が日常的に母親におやすみのキスをする確率は約20%である。10代の男子14人を無作為に調べる。X = 日常的に母親におやすみのキスをする10代の男子の人数、とする。
- B(14,0.20)
- P(2.8)
- N(2.8,2.24)
- Exp
55. A 2008 report on technology use states that approximately 20% of U.S. households have never sent an e-mail. Suppose that we select a random sample of fourteen U.S. households. Let X = the number of households in a 2008 sample of 14 households that have never sent an email
55。技術利用に関する2008年の報告によると、米国の世帯の約20%は電子メールを送ったことがない。米国の14世帯を無作為標本として選ぶとする。X = 2008年の14世帯の標本で、電子メールを送ったことがない世帯数、とする。
- B(14,0.20)
- P(2.8)
- N(2.8,2.24)
- Exp
Chapter 8第8章
Use the following information to answer the next three exercises: Suppose that a sample of 15 randomly chosen people were put on a special weight loss diet. The amount of weight lost, in pounds, follows an unknown distribution with mean equal to 12 pounds and standard deviation equal to three pounds. Assume that the distribution for the weight loss is normal.
英語のヒント
次の情報を用いて、続く3問に答えよ。無作為に選んだ15人の標本に、特別な減量食を試してもらったとする。減量した体重(ポンド)は、平均12ポンド、標準偏差3ポンドの未知の分布に従う。減量した体重の分布は正規分布であると仮定する。
56. To find the probability that the mean amount of weight lost by 15 people is no more than 14 pounds, the random variable should be:
56。15人の平均減量が14ポンド以下である確率を求めるには、確率変数をどれにすべきか。
- number of people who lost weight on the special weight loss diet.特別な減量食で体重が減った人数。
- the number of people who were on the diet.その食事法を行った人数。
- the mean amount of weight lost by 15 people on the special weight loss diet.特別な減量食を行った15人の平均減量。
- the total amount of weight lost by 15 people on the special weight loss diet.特別な減量食を行った15人の減量の合計。
57. Find the probability asked for in Question 56.
57。問56で尋ねた確率を求めよ。
58. Find the 90th percentile for the mean amount of weight lost by 15 people.
58。15人の平均減量の90パーセンタイルを求めよ。
Using the following information to answer the next three exercises: The time of occurrence of the first accident during rush-hour traffic at a major intersection is uniformly distributed between the three hour interval 4 p.m. to 7 p.m. Let X = the amount of time (hours) it takes for the first accident to occur.
英語のヒント
次の情報を用いて、続く3問に答えよ。主要な交差点のラッシュアワーにおける最初の事故の発生時刻は、午後4時から午後7時までの3時間の区間で一様に分布する。X = 最初の事故が起きるまでの時間(時間単位)、とする。
59. What is the probability that the time of occurrence is within the first half-hour or the last hour of the period from 4 to 7 p.m.?
59。午後4~7時のうち、最初の30分間または最後の1時間に事故が起きる確率はいくつか。
- cannot be determined from the information given与えられた情報からは判断できない。
60. The 20th percentile occurs after how many hours?
60。20パーセンタイルは、何時間後に当たるか。
- 0.20
- 0.60
- 0.50
- 1
61. Assume Ramon has kept track of the times for the first accidents to occur for 40 different days. Let C = the total cumulative time. Then C follows which distribution?
61。ラモンが40日間について、最初の事故が起きるまでの時間を記録したとする。C = それらの時間の合計、とする。C はどの分布に従うか。
- U(0,3)
- Exp(13)
- N(60, 5.477)
- N(1.5, 0.01875)
62. Using the information in Question 61, find the probability that the total time for all first accidents to occur is more than 43 hours.
62。問61の情報を用いて、各日の最初の事故までの時間の合計が43時間を超える確率を求めよ。
Use the following information to answer the next two exercises: The length of time a parent must wait for his children to clean their rooms is uniformly distributed in the time interval from one to 15 days.
次の情報を用いて、続く2問に答えよ。親が子どもに部屋を掃除してもらうまで待つ時間は、1~15日の区間で一様に分布する。
63. How long must a parent expect to wait for his children to clean their rooms?
63。子どもが部屋を掃除するまで、親はどのくらい待つと予想されるか。
- eight days8日
- three days3日
- 14 days14日
- six days6日
64. What is the probability that a parent will wait more than six days given that the parent has already waited more than three days?
64。親がすでに3日を超えて待ったという条件のもとで、待ち時間が6日を超える確率はいくつか。
- 0.5174
- 0.0174
- 0.7500
- 0.2143
Use the following information to answer the next five exercises: Twenty percent of the students at a local community college live in within five miles of the campus. Thirty percent of the students at the same community college receive some kind of financial aid. Of those who live within five miles of the campus, 75% receive some kind of financial aid.
次の情報を用いて、続く5問に答えよ。地元のコミュニティ・カレッジでは、学生の20%がキャンパスから5マイル以内に住んでいる。同校の学生の30%は、何らかの経済的支援を受けている。キャンパスから5マイル以内に住む学生のうち75%が、何らかの経済的支援を受けている。
65. Find the probability that a randomly chosen student at the local community college does not live within five miles of the campus.
65。同校から無作為に選んだ学生が、キャンパスから5マイル以内には住んでいない確率を求めよ。
- 80%
- 20%
- 30%
- cannot be determined判断できない。
66. Find the probability that a randomly chosen student at the local community college lives within five miles of the campus or receives some kind of financial aid.
66。同校から無作為に選んだ学生が、キャンパスから5マイル以内に住んでいる、または何らかの経済的支援を受けている確率を求めよ。
- 50%
- 35%
- 27.5%
- 75%
67. Are living in student housing within five miles of the campus and receiving some kind of financial aid mutually exclusive?
67。キャンパスから5マイル以内の学生用住宅に住むことと、何らかの経済的支援を受けることは、互いに排反か。
- yesはい。
- noいいえ。
- cannot be determined判断できない。
68. The interest rate charged on the financial aid is _______ data.
68。経済的支援の貸付に課される利率は、_______データである。
- quantitative discrete量的離散
- quantitative continuous量的連続
- qualitative discrete離散型の質的データ
- qualitative質的
69. The following information is about the students who receive financial aid at the local community college.
69。次の情報は、地元のコミュニティ・カレッジで経済的支援を受ける学生についてのものである。
- 1st quartile = $250第1四分位数 = 250ドル
- 2nd quartile = $700第2四分位数 = 700ドル
- 3rd quartile = $1200第3四分位数 = 1200ドル
These amounts are for the school year. If a sample of 200 students is taken, how many are expected to receive $250 or more?
これらは1学年度の金額である。200人の学生を標本に選んだ場合、250ドル以上を受け取ると予想される人数はいくつか。
- 50
- 250
- 150
- cannot be determined判断できない。
Use the following information to answer the next two exercises: P(A) = 0.2, P(B) = 0.3; A and B are independent events.
次の情報を用いて、続く2問に答えよ。P(A) = 0.2、P(B) = 0.3 であり、A と B は独立な事象である。
70. P(A AND B) = ______
70。P(A かつ B) = ______
- 0.5
- 0.6
- 0
- 0.06
71. P(A OR B) = _______
71。P(A または B) = _______
- 0.56
- 0.5
- 0.44
- 1
72. If H and D are mutually exclusive events, P(H) = 0.25, P(D) = 0.15, then P(H|D).
72。H と D が互いに排反な事象で、P(H) = 0.25、P(D) = 0.15 のとき、P(H|D) を求めよ。
- 1
- 0
- 0.40
- 0.0375