付録
Practice Final Exam 1 Solutions期末模擬試験1の解答
Solutions解答
1. b. independent
1. b. 独立
2. c.
3. b. Two measurements are drawn from the same pair of individuals or objects.
3. b. 同じ個人または対象物の組から、二つの測定値を得る。
4. b.
5. d.
6. b.
7. b. 2.78
8. a. 8.25
9. c. 0.2870
10. c. Normal
10. c. 正規分布
11. d. Ha: pA ≠ pB
12. b. conclude that the pass rate for Math 1A is different than the pass rate for Math 1B when, in fact, the pass rates are the same.
12. b. 実際には合格率が同じなのに、Math 1AとMath 1Bの合格率は異なると結論づける。
13. b. not reject H0
13. b. H0を棄却しない。
14. c. Iris
14. c. アイリス
15. c. Student's t
15. c. スチューデントのt分布
16. b. is left-tailed.
16. b. 左片側検定である。
17. c. cluster sampling
17. c. クラスター抽出
18. b. median
18. b. 中央値
19. a. the probability that an outcome of the data will happen purely by chance when the null hypothesis is true.
19. a. 帰無仮説が正しいときに、データの結果が純粋に偶然だけで起こる確率。
20. d. stratified
20. d. 層化抽出
21. b. 25
22. c. 4
23. a. (1.85, 2.32)
24. c. Both above are correct.
24. c. 上の2つはどちらも正しい。
25. c. 5.8
26. c. 0.6321
27. a. 0.8413
28. a. (0.6030, 0.7954)
29. a.
30. d. 3.66
31. b. 5.1
32. a. 13.46
33. b. There is a strong linear pattern. Therefore, it is most likely a good model to be used.
33. b. 強い直線的なパターンがある。そのため、利用するモデルとして適している可能性が高い。
34. b. .
35. d. 70
36. b. There is sufficient evidence to conclude that the choice of major and the gender of the student are not independent of each other.
36. b. 専攻の選択と学生の性別が互いに独立ではないと結論づけるのに十分な証拠がある。
37. a. goodness-of-fit
37. a. 適合度検定
Practice Final Exam 2期末模擬試験2
1. A study was done to determine the proportion of teenagers that own a car. The population proportion of teenagers that own a car is the:
1. 自動車を所有している10代の人の割合を調べた。自動車を所有している10代の人の母比率は、次のどれに当たるか。
- statistic.統計量。
- parameter.母数。
- population.母集団。
- variable.変数。
Use the following information to answer the next two exercises:
次の情報を用いて、続く2問に答えよ。
value 値 |
frequency 度数 |
|---|---|
0 |
1 |
1 |
4 |
2 |
7 |
3 |
9 |
6 |
4 |
2. The box plot for the data is:
2. このデータの箱ひげ図はどれか。
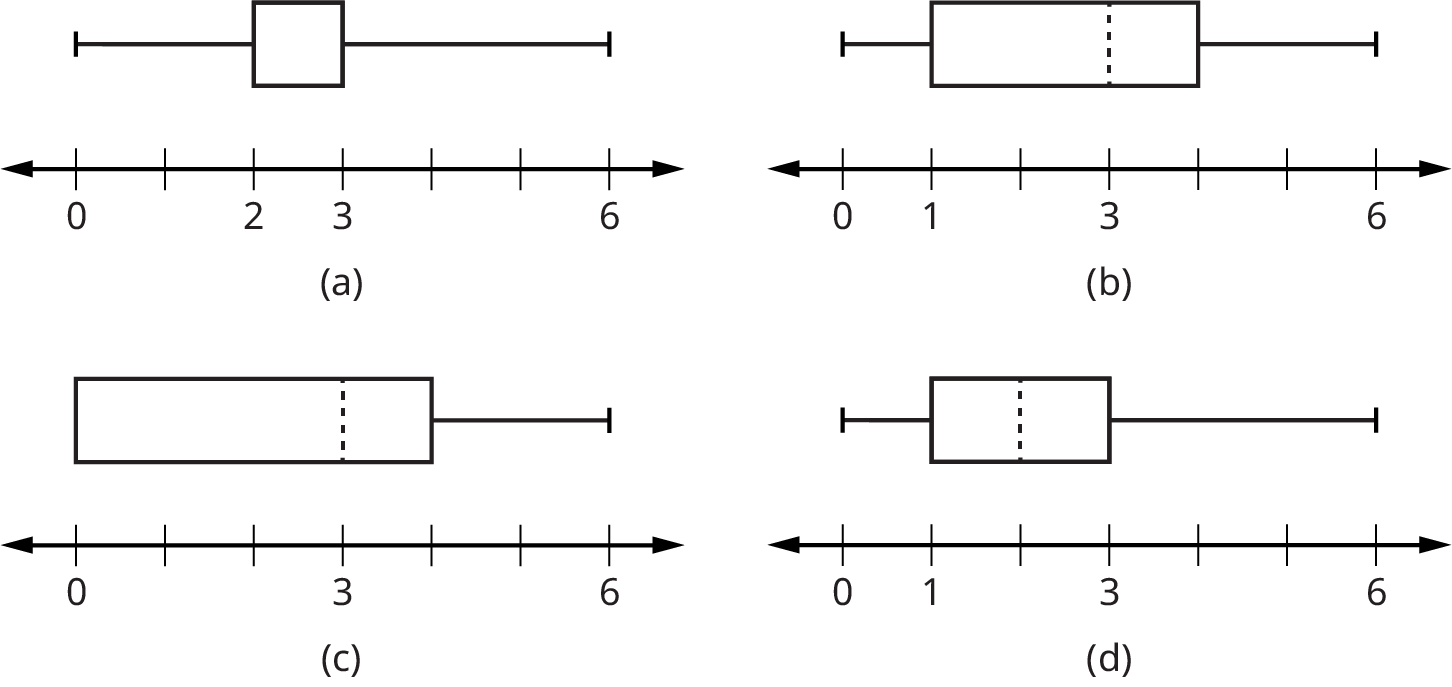
Figure B.10図 B.10
3. If six were added to each value of the data in the table, the 15th percentile of the new list of values is:
3. 表のデータの各値に6を加えた場合、新しいデータの第15パーセンタイルはいくらか。
- six6
- one1
- seven7
- eight8
Use the following information to answer the next two exercises: Suppose that the probability of a drought in any independent year is 20%. Out of those years in which a drought occurs, the probability of water rationing is ten percent. However, in any year, the probability of water rationing is five percent.
英語のヒント
次の情報を用いて、続く2問に答えよ。各年は独立で、ある年に干ばつが起こる確率を20%とする。干ばつが起こる年に給水制限が行われる確率は10%である。一方、任意の年に給水制限が行われる確率は5%である。
4. What is the probability of both a drought and water rationing occurring?
4. 干ばつと給水制限の両方が起こる確率はいくらか。
- 0.05
- 0.01
- 0.02
- 0.30
5. Which of the following is true?
5. 次のうち正しいものはどれか。
- Drought and water rationing are independent events.干ばつと給水制限は独立な事象である。
- Drought and water rationing are mutually exclusive events.干ばつと給水制限は互いに排反な事象である。
- None of the above上のいずれでもない。
Use the following information to answer the next two exercises: Suppose that a survey yielded the following data:
英語のヒント
次の情報を用いて、続く2問に答えよ。調査から次のデータが得られたとする。
gender 性別 |
apple リンゴ |
pumpkin カボチャ |
pecan ピーカンナッツ |
|---|---|---|---|
female 女性 |
40 |
10 |
30 |
male 男性 |
20 |
30 |
10 |
6. Suppose that one individual is randomly chosen. The probability that the person’s favorite pie is apple or the person is male is _____.
6. 1人を無作為に選ぶ。その人の好きなパイがアップルパイであるか、または男性である確率は_____である。
7. Suppose H0 is: Favorite pie and gender are independent. The p-value is ______.
7. H0を「好きなパイと性別は独立である」とする。p値は______である。
- ≈ 0
- 1
- 0.05
- cannot be determined判断できない。
Use the following information to answer the next two exercises: Let’s say that the probability that an adult watches the news at least once per week is 0.60. We randomly survey 14 people. Of interest is the number of people who watch the news at least once per week.
次の情報を用いて、続く2問に答えよ。ある成人が少なくとも週1回ニュースを見る確率は0.60とする。14人を無作為に調査する。関心があるのは、少なくとも週1回ニュースを見る人の人数である。
8. Which of the following statements is FALSE?
8. 次の記述のうち、誤っているものはどれか。
- X ~ B(14 0.60)
- The values for x are: {1 ,2 ,3 ,... ,14}.xの値は{1, 2, 3, …, 14}である。
- μ = 8.4
- P(X = 5) = 0.0408
9. Find the probability that at least six adults watch the news at least once per week.
9. 少なくとも6人の成人が少なくとも週1回ニュースを見る確率を求めよ。
- 0.8499
- 0.9417
- 0.6429
10. The following histogram is most likely to be a result of sampling from which distribution?
10. 次のヒストグラムは、どの分布から標本を抽出した結果である可能性が最も高いか。
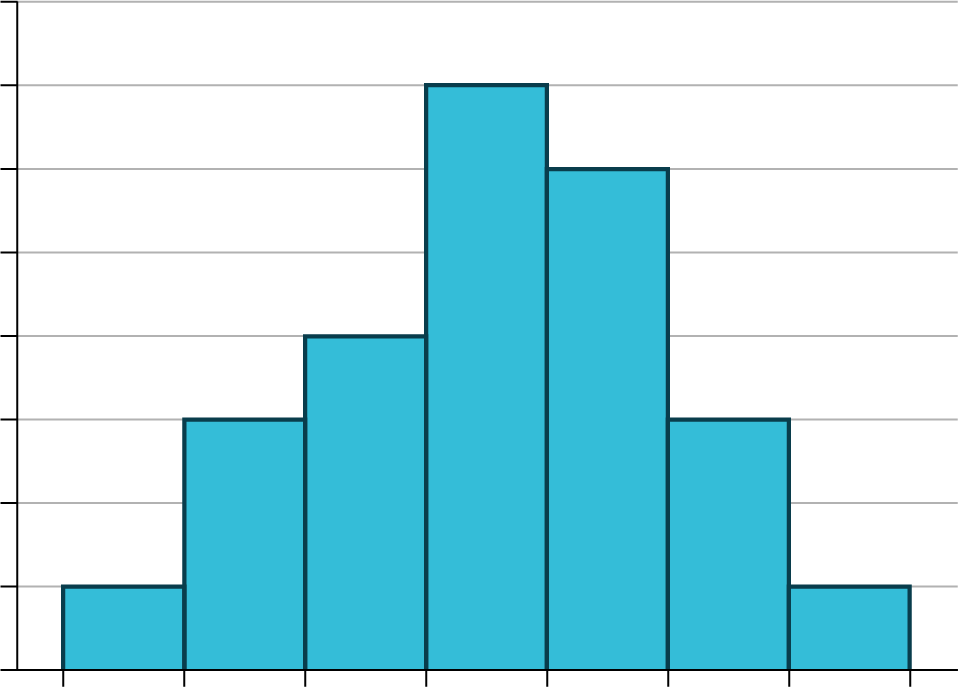
Figure B.11図 B.11
- chi-square with df = 6自由度df = 6のカイ二乗分布
- exponential指数分布
- uniform一様分布
- binomial二項分布
11. The ages of campus day and evening students is known to be normally distributed. A sample of six campus day and evening students reported their ages (in years) as: {18, 35, 27, 45, 20, 20}. What is the error bound for the 90% confidence interval of the true average age?
11. 大学の昼間部と夜間部の学生の年齢は、正規分布に従うとわかっている。昼間部と夜間部の学生6人の標本で、年齢(歳)は{18, 35, 27, 45, 20, 20}と報告された。真の平均年齢の90%信頼区間の誤差限界はいくらか。
- 11.2
- 22.3
- 17.5
- 8.7
12. If a normally distributed random variable has µ = 0 and σ = 1, then 97.5% of the population values lie above:
12. 正規分布に従う確率変数の平均がµ = 0、標準偏差がσ = 1であるとき、母集団の値の97.5%はどの値より上にあるか。
- –1.96.
- 1.96.
- 1.
- –1.
Use the following information to answer the next three exercises. The amount of money a customer spends in one trip to the supermarket is known to have an exponential distribution. Suppose the average amount of money a customer spends in one trip to the supermarket is $72.
次の情報を用いて、続く3問に答えよ。顧客がスーパーマーケットへの1回の買い物で使う金額は、指数分布に従うとわかっている。この金額の平均が72ドルであるとする。
13. What is the probability that one customer spends less than $72 in one trip to the supermarket?
13. 1人の顧客がスーパーマーケットへの1回の買い物で使う金額が72ドル未満となる確率はいくらか。
- 0.6321
- 0.5000
- 0.3714
- 1
14. How much money altogether would you expect the next five customers to spend in one trip to the supermarket (in dollars)?
英語のヒント
14. 次の5人の顧客がスーパーマーケットへの1回の買い物で使う金額は、合計で何ドルと予想されるか。
- 72
- 5184
- 360
15. If you want to find the probability that the mean amount of money 50 customers spend in one trip to the supermarket is less than $60, the distribution to use is:
15. 50人の顧客がスーパーマーケットへの1回の買い物で使う金額の平均が60ドル未満となる確率を求めるには、どの分布を用いるか。
- N(72, 72)
- Exp(72)
Use the following information to answer the next three exercises: The amount of time it takes a fourth grader to carry out the trash is uniformly distributed in the interval from one to ten minutes.
英語のヒント
次の情報を用いて、続く3問に答えよ。小学4年生がごみを外へ運び出すのにかかる時間は、1分から10分までの区間の一様分布に従う。
16. What is the probability that a randomly chosen fourth grader takes more than seven minutes to take out the trash?
16. 無作為に選んだ小学4年生がごみ出しに7分を超える時間をかける確率はいくらか。
17. Which graph best shows the probability that a randomly chosen fourth grader takes more than six minutes to take out the trash given that they have already taken more than three minutes?
英語のヒント
17. 無作為に選んだ小学4年生のごみ出しにすでに3分を超える時間がかかっているとき、6分を超える時間がかかる確率を最も適切に示すグラフはどれか。
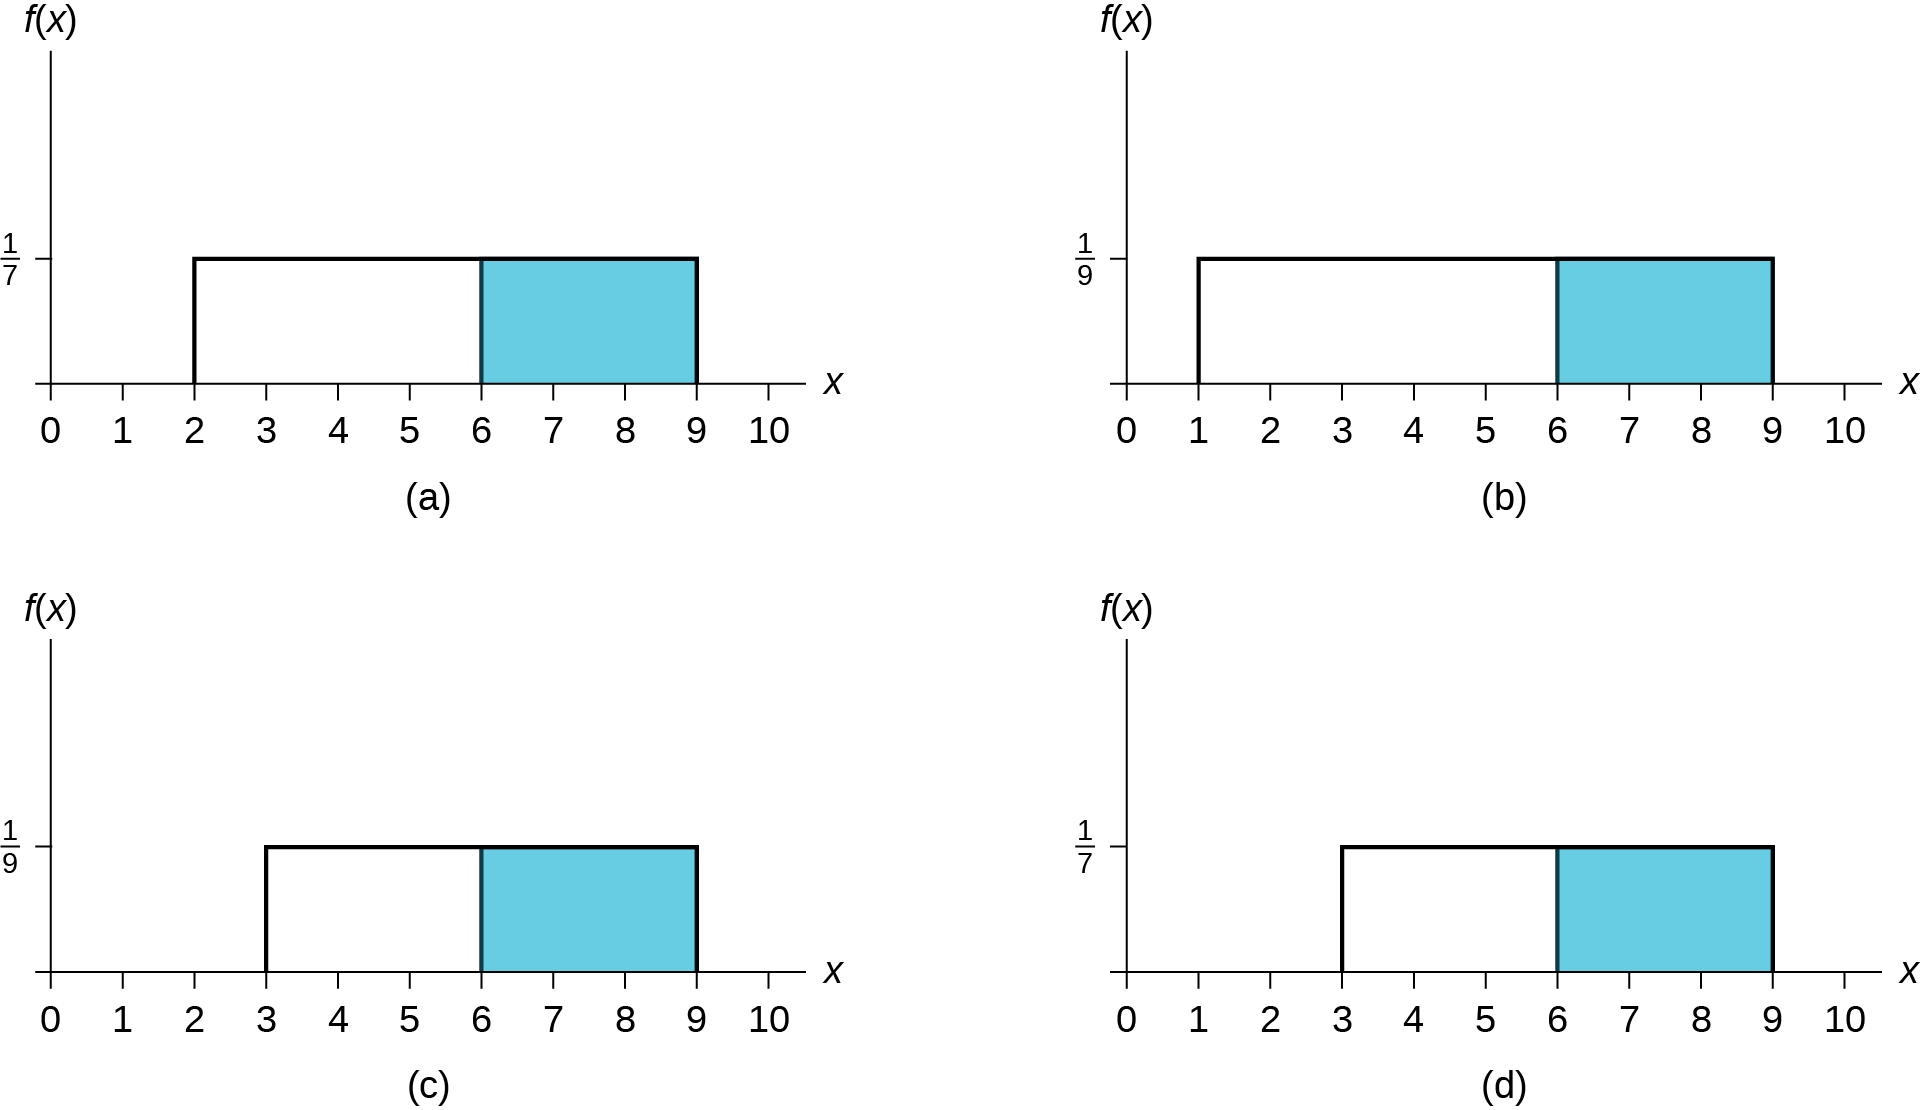
Figure B.12図 B.12
18. We should expect a fourth grader to take how many minutes to take out the trash?
18. 小学4年生のごみ出しにかかる時間は、何分と予想されるか。
- 4.5
- 5.5
- 5
- 10
Use the following information to answer the next three exercises: At the beginning of the quarter, the amount of time a student waits in line at the campus cafeteria is normally distributed with a mean of five minutes and a standard deviation of 1.5 minutes.
英語のヒント
次の情報を用いて、続く3問に答えよ。学期の初めに、学生が学内の食堂の列に並んで待つ時間は、平均5分、標準偏差1.5分の正規分布に従う。
19. What is the 90th percentile of waiting times (in minutes)?
19. 待ち時間の第90パーセンタイルは何分か。
- 1.28
- 90
- 7.47
- 6.92
20. The median waiting time (in minutes) for one student is:
20. 学生1人の待ち時間の中央値は何分か。
- 5.
- 50.
- 2.5.
- 1.5.
21. Find the probability that the average wait time for ten students is at most 5.5 minutes.
21. 10人の学生の平均待ち時間が5.5分以下となる確率を求めよ。
- 0.6301
- 0.8541
- 0.3694
- 0.1459
22. A sample of 80 software engineers in Silicon Valley is taken and it is found that 20% of them earn approximately $50,000 per year. A point estimate for the true proportion of engineers in Silicon Valley who earn $50,000 per year is:
22. シリコンバレーのソフトウェア技術者80人を標本として調べたところ、20%が年間およそ50,000ドルを稼いでいた。シリコンバレーの技術者に占める年収50,000ドルの人の真の割合の点推定値はどれか。
- 16.
- 0.2.
- 1.
- 0.95.
23. If P(Z < zα) = 0.1587 where Z ~ N(0, 1), then α is equal to:
23. Z ~ N(0, 1)で、P(Z < zα) = 0.1587であるとき、αはいくらか。
- –1.
- 0.1587.
- 0.8413.
- 1.
24. A professor tested 35 students to determine their entering skills. At the end of the term, after completing the course, the same test was administered to the same 35 students to study their improvement. This would be a test of:
英語のヒント
24. ある教員は、35人の学生に受講開始時の能力を調べる試験を実施した。学期末に授業を修了した後、同じ35人に同じ試験を実施して向上の程度を調べた。これは何の検定になるか。
- independent groups.独立した群。
- two proportions.2つの比率。
- matched pairs, dependent groups.対応のあるペア、従属した群。
- exclusive groups.互いに排反な群。
A math exam was given to all the third grade children attending ABC School. Two random samples of scores were taken.
ABC小学校の3年生全員に数学の試験を実施し、得点から2つの無作為標本を抽出した。
n |
s |
||
|---|---|---|---|
Boys 男子 |
55 |
82 |
5 |
Girls 女子 |
60 |
86 |
7 |
25. Which of the following correctly describes the results of a hypothesis test of the claim, “There is a difference between the mean scores obtained by third grade girls and boys at the 5% level of significance”?
25. 「3年生の女子と男子の平均点には差がある」という主張について有意水準5%で仮説検定を行う。その結果を正しく述べているものはどれか。
- Do not reject H0. There is insufficient evidence to conclude that there is a difference in the mean scores.H0を棄却しない。平均点に差があると結論づけるには証拠が不十分である。
- Do not reject H0. There is sufficient evidence to conclude that there is a difference in the mean scores.H0を棄却しない。平均点に差があると結論づけるのに十分な証拠がある。
- Reject H0. There is insufficient evidence to conclude that there is no difference in the mean scores.H0を棄却する。平均点に差がないと結論づけるには証拠が不十分である。
- Reject H0. There is sufficient evidence to conclude that there is a difference in the mean scores.H0を棄却する。平均点に差があると結論づけるのに十分な証拠がある。
26. In a survey of 80 males, 45 had played an organized sport growing up. Of the 70 females surveyed, 25 had played an organized sport growing up. We are interested in whether the proportion for males is higher than the proportion for females. The correct conclusion is that:
26. 男性80人を調査したところ、45人は成長期に組織的なスポーツに参加していた。調査した女性70人のうち、25人が成長期に組織的なスポーツに参加していた。男性の割合が女性の割合よりも高いかどうかに関心がある。正しい結論はどれか。
- there is insufficient information to conclude that the proportion for males is the same as the proportion for females.男性の割合が女性の割合と同じであると結論づけるには、情報が不十分である。
- there is insufficient information to conclude that the proportion for males is not the same as the proportion for females.男性の割合が女性の割合と同じではないと結論づけるには、情報が不十分である。
- there is sufficient evidence to conclude that the proportion for males is higher than the proportion for females.男性の割合が女性の割合よりも高いと結論づけるのに十分な証拠がある。
- not enough information to make a conclusion.結論を出すには情報が不十分である。
27. From past experience, a statistics teacher has found that the average score on a midterm is 81 with a standard deviation of 5.2. This term, a class of 49 students had a standard deviation of 5 on the midterm. Do the data indicate that we should reject the teacher’s claim that the standard deviation is 5.2? Use α = 0.05.
27. ある統計学の教員は、過去の経験から中間試験の平均点は81点、標準偏差は5.2点だと把握している。今学期、49人のクラスの中間試験の標準偏差は5点だった。このデータは、標準偏差が5.2点であるという教員の主張を棄却すべきことを示しているか。α = 0.05を用いよ。
- Yesはい。
- Noいいえ
- Not enough information given to solve the problem問題を解くための情報が不足している。
28. Three loading machines are being compared. Ten samples were taken for each machine. Machine I took an average of 31 minutes to load packages with a standard deviation of two minutes. Machine II took an average of 28 minutes to load packages with a standard deviation of 1.5 minutes. Machine III took an average of 29 minutes to load packages with a standard deviation of one minute. Find the p-value when testing that the average loading times are the same.
英語のヒント
28. 3台の積み込み機械を比較する。各機械について10個の標本をとった。機械Iが荷物の積み込みにかけた時間は平均31分、標準偏差2分だった。機械IIでは平均28分、標準偏差1.5分、機械IIIでは平均29分、標準偏差1分だった。平均積み込み時間が等しいという仮説を検定するときのp値を求めよ。
- p-value is close to zerop値は0に近い。
- p-value is close to onep値は1に近い。
- not enough information given to solve the problem問題を解くための情報が不足している。
Use the following information to answer the next three exercises: A corporation has offices in different parts of the country. It has gathered the following information concerning the number of bathrooms and the number of employees at seven sites:
英語のヒント
次の情報を用いて、続く3問に答えよ。ある企業は国内の各地に事業所を持っている。7か所の事業所について、トイレの数と従業員数に関する次の情報を集めた。
Number of employees x 従業員数x |
650 |
730 |
810 |
900 |
102 |
107 |
1150 |
Number of bathrooms y トイレの数y |
40 |
50 |
54 |
61 |
82 |
110 |
121 |
29. Is the correlation between the number of employees and the number of bathrooms significant?
29. 従業員数とトイレの数の相関は有意か。
- Yesはい。
- Noいいえ
- Not enough information to answer question問いに答えるための情報が不足している。
30. The linear regression equation is:
30. 線形回帰式はどれか。
- ŷ = 0.0094 − 79.96x
- ŷ = 79.96 + 0.0094x
- ŷ = 79.96 − 0.0094x
- ŷ = − 0.0094 + 79.96x
31. If a site has 1,150 employees, approximately how many bathrooms should it have?
31. ある事業所に従業員が1,150人いる場合、トイレはおよそ何個必要か。
- 69
- 91
- 91,954
- We should not be estimating here.ここでは推定を行うべきではない。
32. Suppose that a sample of size ten was collected, with = 4.4 and s = 1.4. H0: σ2 = 1.6 vs. Ha: σ2 ≠ 1.6. Which graph best describes the results of the test?
32. 大きさ10の標本を抽出し、 = 4.4、s = 1.4を得たとする。H0: σ2 = 1.6に対して、Ha: σ2 ≠ 1.6を検定する。検定結果を最も適切に表すグラフはどれか。
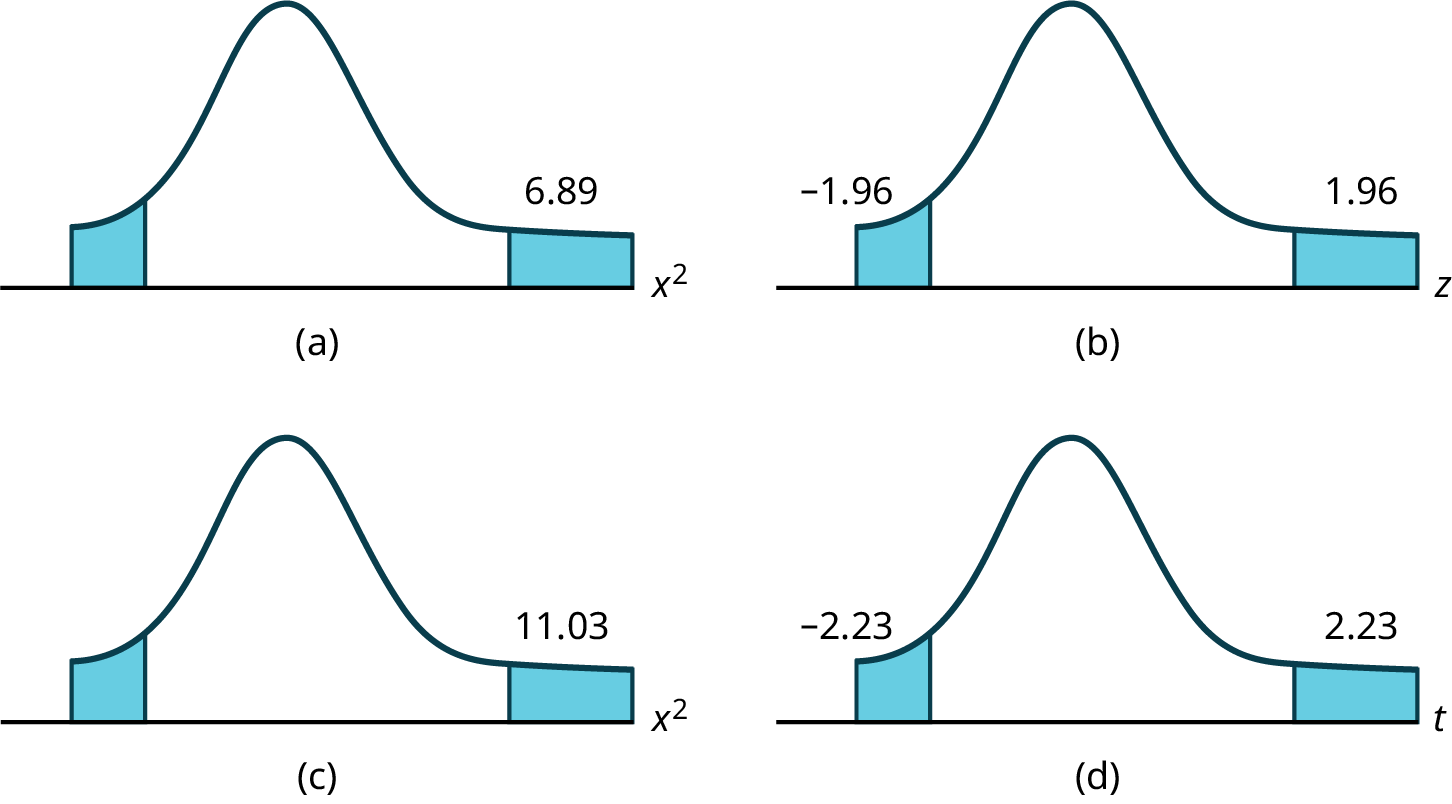


Figure B.13図 B.13
Sixty-four backpackers were asked the number of days since their latest backpacking trip. The number of days is given in Table B.26:
英語のヒント
64人のバックパッカーに、最後のバックパッキング旅行から何日たったかを尋ねた。日数を表B.26に示す。
# of days 日数 |
1 |
2 |
3 |
4 |
5 |
6 |
7 |
8 |
Frequency 度数 |
5 |
9 |
6 |
12 |
7 |
10 |
5 |
10 |
33. Conduct an appropriate test to determine if the distribution is uniform.
33. 分布が一様かどうかを調べるため、適切な検定を行え。
- The p-value is > 0.10. There is insufficient information to conclude that the distribution is not uniform.p値は0.10より大きい。分布が一様ではないと結論づけるには、情報が不十分である。
- The p-value is < 0.01. There is sufficient information to conclude the distribution is not uniform.p値は0.01より小さい。分布が一様ではないと結論づけるのに十分な情報がある。
- The p-value is between 0.01 and 0.10, but without alpha (α) there is not enough informationp値は0.01と0.10の間だが、アルファ(α)が与えられていないため、情報が不足している。
- There is no such test that can be conducted.実施できる検定は存在しない。
34. Which of the following statements is true when using one-way ANOVA?
34. 一元配置分散分析を用いるとき、次の記述のうち正しいものはどれか。
- The populations from which the samples are selected have different distributions.標本を抽出する母集団は、異なる分布を持つ。
- The sample sizes are large.標本の大きさが大きい。
- The test is to determine if the different groups have the same means.異なる群の平均が等しいかどうかを調べる検定である。
- There is a correlation between the factors of the experiment.実験の要因間に相関がある。