付録
Chapter 5第5章
Use the following information to answer the next seven exercises: A recent study of mothers of junior high school children in Santa Clara County reported that 76% of the mothers are employed in paid positions. Of those mothers who are employed, 64% work full-time (over 35 hours per week), and 36% work part-time. However, out of all of the mothers in the population, 49% work full-time. The population under study is made up of mothers of junior high school children in Santa Clara County. Let E = employed and F = full-time employment.
英語のヒント
次の情報を用いて、続く7問に答えよ。サンタクララ郡の中学生の母親についての最近の研究では、母親の76%が有給の仕事に就いていると報告された。就業している母親のうち、64%はフルタイム(週35時間超)、36%はパートタイムで働いている。一方、母集団の母親全体では49%がフルタイムで働いている。調査対象の母集団は、サンタクララ郡の中学生の母親からなる。E = 就業していること、F = フルタイムで就業していること、とする。
25.
- Find the percent of all mothers in the population that are NOT employed.母集団の母親全体のうち、就業していない人の割合を求めよ。
- Find the percent of mothers in the population that are employed part-time.母集団の母親のうち、パートタイムで就業している人の割合を求めよ。
26. The “type of employment” is considered to be what type of data?
26。「就業形態」はどの種類のデータと考えられるか。
27. Find the probability that a randomly selected mother works part-time given that she is employed.
27。無作為に選んだ母親が就業しているという条件のもとで、パートタイムで働いている確率を求めよ。
28. Find the probability that a randomly selected person from the population will be employed or work full-time.
28。母集団から無作為に選んだ人が、就業している、またはフルタイムで働いている確率を求めよ。
29. Being employed and working part-time:
29。就業していることとパートタイムで働いていることについて、次を答えよ。
- mutually exclusive events? Why or why not?互いに排反な事象か。その理由を説明せよ。
- independent events? Why or why not?独立な事象か。その理由を説明せよ。
Use the following additional information to answer the next two exercises: We randomly pick ten mothers from the above population. We are interested in the number of the mothers that are employed. Let X = number of mothers that are employed.
次の追加情報を用いて、続く2問に答えよ。上の母集団から母親10人を無作為に選ぶ。そのうち就業している人数に関心がある。X = 就業している母親の人数、とする。
30. State the distribution for X.
30。X の分布を示せ。
31. Find the probability that at least six are employed.
31。就業している人が6人以上である確率を求めよ。
32. We expect the statistics discussion board to have, on average, 14 questions posted to it per week. We are interested in the number of questions posted to it per day.
32。統計学の掲示板には、平均して週に14件の質問が投稿されると予想される。1日に投稿される質問の件数に関心がある。
- Define X.X を定義せよ。
- What are the values that the random variable may take on?この確率変数が取りうる値は何か。
- State the distribution for X.X の分布を示せ。
- Find the probability that from ten to 14 (inclusive) questions are posted to the listserv on a randomly picked day.無作為に選んだ1日に、メーリングリストに10~14件(両端を含む)の質問が投稿される確率を求めよ。
33. A person invests $1,000 into stock of a company that hopes to go public in one year. The probability that the person will lose all his money after one year (i.e. his stock will be worthless) is 35%. The probability that the person’s stock will still have a value of $1,000 after one year (i.e. no profit and no loss) is 60%. The probability that the person’s stock will increase in value by $10,000 after one year (i.e. will be worth $11,000) is 5%. Find the expected profit after one year.
英語のヒント
33。ある人が、1年後の株式公開を目指す会社の株式に1000ドルを投資する。1年後に全額を失う(株式の価値がなくなる)確率は35%である。1年後にも株式の価値が1000ドルのまま(利益も損失もない)である確率は60%である。1年後に株式の価値が10,000ドル増加する(11,000ドルの価値になる)確率は5%である。1年後の利益の期待値を求めよ。
34. Rachel’s piano cost $3,000. The average cost for a piano is $4,000 with a standard deviation of $2,500. Becca’s guitar cost $550. The average cost for a guitar is $500 with a standard deviation of $200. Matt’s drums cost $600. The average cost for drums is $700 with a standard deviation of $100. Whose cost was lowest when compared to their own instrument?
34。レイチェルのピアノは3000ドルだった。ピアノの平均価格は4000ドル、標準偏差は2500ドルである。ベッカのギターは550ドルだった。ギターの平均価格は500ドル、標準偏差は200ドルである。マットのドラムは600ドルだった。ドラムの平均価格は700ドル、標準偏差は100ドルである。それぞれ同じ種類の楽器と比較したとき、価格が最も低いのは誰か。
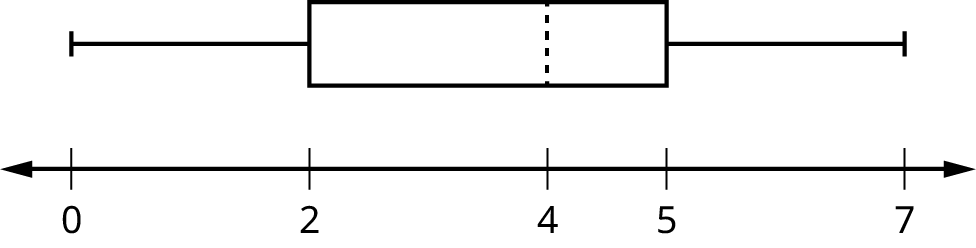
Figure A.2図 A.2
35. Explain why each statement is either true or false given the box plot in Figure A.2.
35。図A.2の箱ひげ図に基づき、各記述が正しいか誤りか、その理由を説明せよ。
- Twenty-five percent of the data re at most five.データの25%が5以下である。
- There is the same amount of data from 4–5 as there is from 5–7.4~5の範囲と5~7の範囲に、同じ数のデータがある。
- There are no data values of three.値が3のデータはない。
- Fifty percent of the data are four.データの50%が4である。
Using the following information to answer the next two exercises: 64 faculty members were asked the number of cars they owned (including spouse and children’s cars). The results are given in the following graph:
次の情報を用いて、続く2問に答えよ。64人の教員に、所有する車の台数(配偶者や子どもの車を含む)を尋ねた。結果を次のグラフに示す。
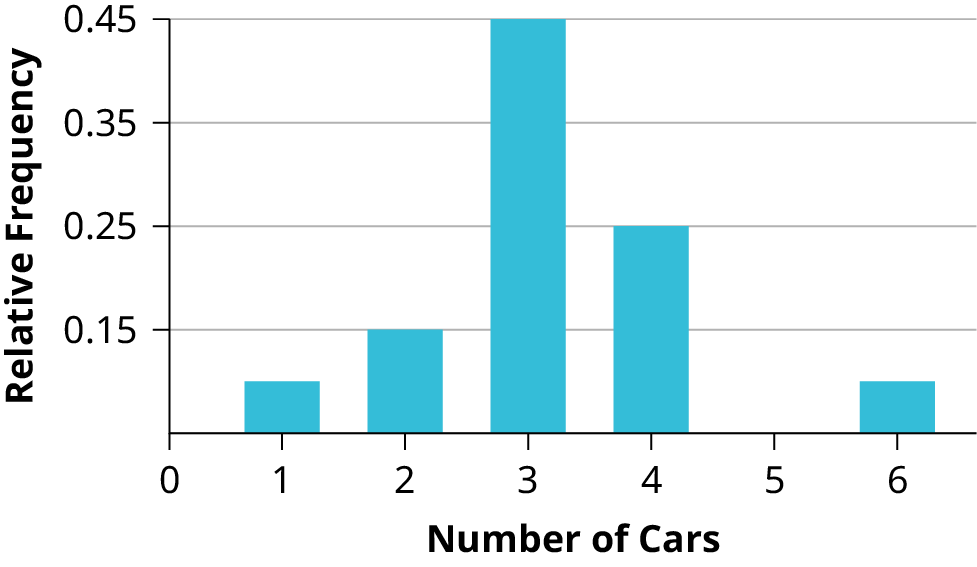


Figure A.3図 A.3
36. Find the approximate number of responses that were three.
36。3台と答えた人のおよその人数を求めよ。
37. Find the first, second and third quartiles. Use them to construct a box plot of the data.
37。第1、第2、第3四分位数を求め、それらを用いてデータの箱ひげ図を作成せよ。
Use the following information to answer the next three exercises: Table A.3 shows data gathered from 15 girls on the Snow Leopard soccer team when they were asked how they liked to wear their hair. Supposed one girl from the team is randomly selected.
次の情報を用いて、続く3問に答えよ。表A.3は、サッカーチーム「スノー・レパード」の女子選手15人に、どのような髪形を好むかを尋ねた結果である。チームから1人を無作為に選ぶとする。
Hair Style/Hair Color 髪形/髪の色 |
Blond 金髪 |
Brown ブラウン |
Black 黒人 |
|---|---|---|---|
Ponytail ポニーテール |
3 |
2 |
5 |
Plain 髪を下ろす |
2 |
2 |
1 |
38. Find the probability that the girl has black hair GIVEN that she wears a ponytail.
38。ポニーテールであるという条件のもとで、髪が黒い確率を求めよ。
39. Find the probability that the girl wears her hair plain OR has brown hair.
39。髪を下ろしている、または髪が茶色である確率を求めよ。
40. Find the probability that the girl has blond hair AND that she wears her hair plain.
40。髪が金色であり、かつ髪を下ろしている確率を求めよ。