付録
12.3: Scatter Plots12.3:散布図
9. Describe the pattern in this scatter plot, and decide whether the X and Y variables would be good candidates for linear regression.
9。この散布図のパターンを説明し、変数 X と Y が線形回帰に適しているかを判断せよ。
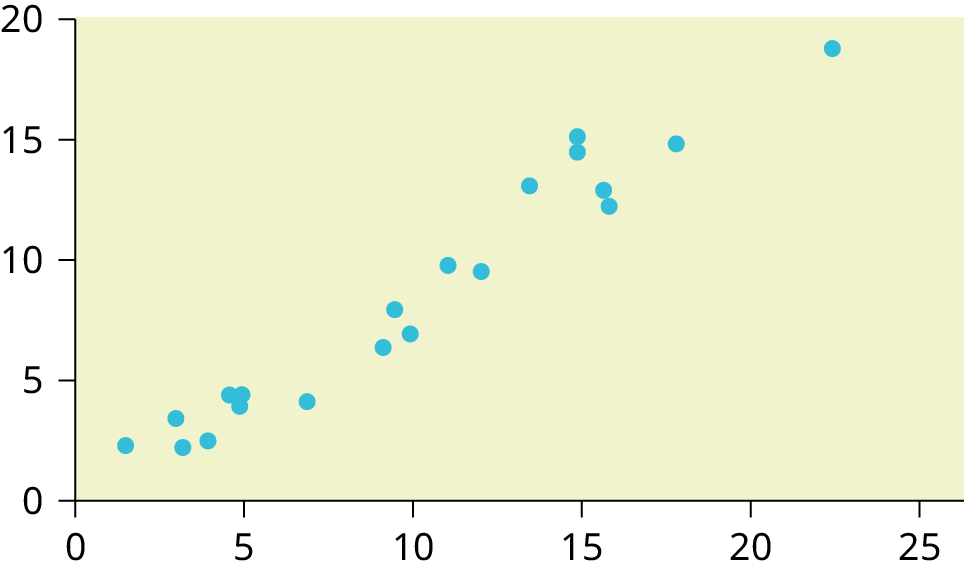
Figure B.4図 B.4
10. Describe the pattern in this scatter plot, and decide whether the X and Y variables would be good candidates for linear regression.
10。この散布図のパターンを説明し、変数 X と Y が線形回帰に適しているかを判断せよ。
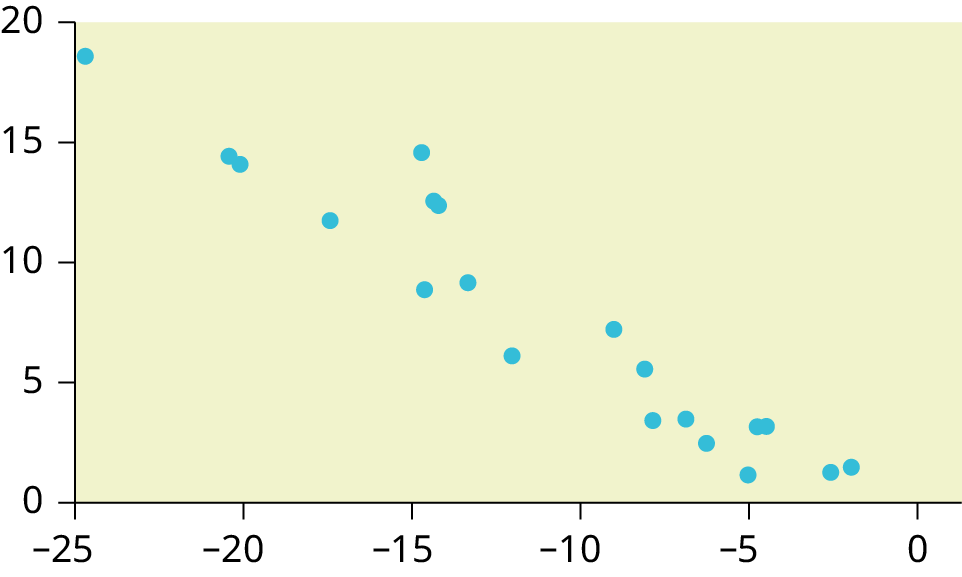
Figure B.5図 B.5
11. Describe the pattern in this scatter plot, and decide whether the X and Y variables would be good candidates for linear regression.
11。この散布図のパターンを説明し、変数 X と Y が線形回帰に適しているかを判断せよ。
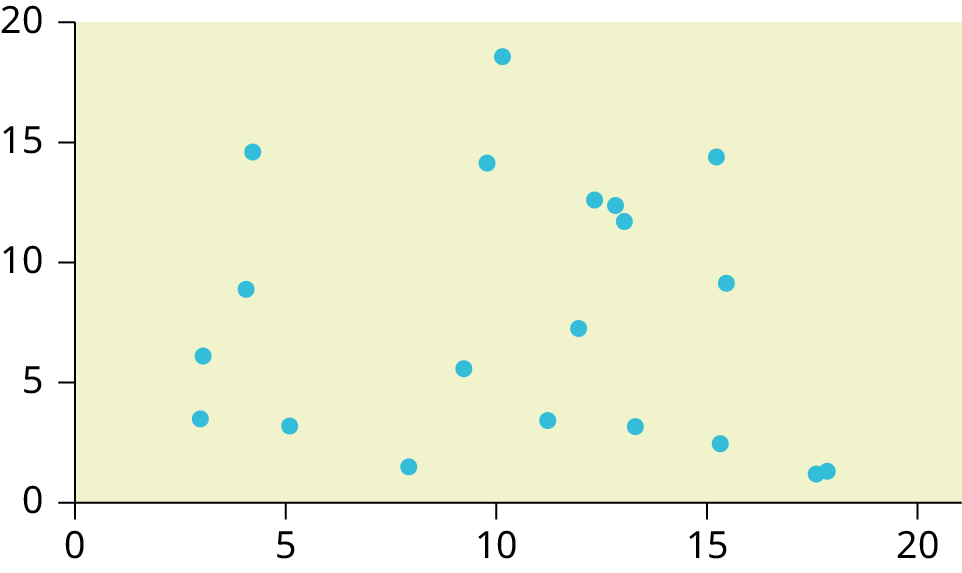
Figure B.6図 B.6
12. Describe the pattern in this scatter plot, and decide whether the X and Y variables would be good candidates for linear regression.
12。この散布図のパターンを説明し、変数 X と Y が線形回帰に適しているかを判断せよ。
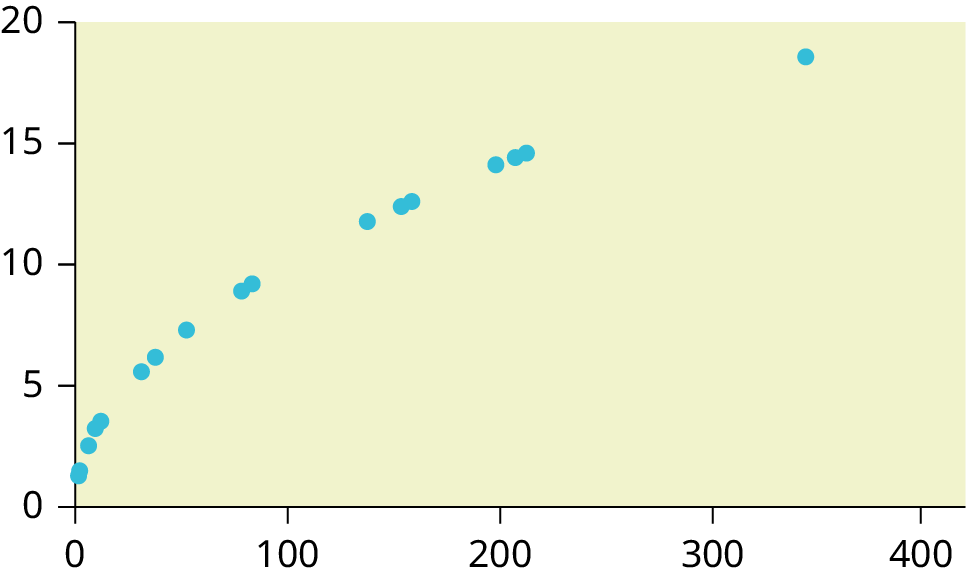


Figure B.7図 B.7
12.4: The Regression Equation12.4:回帰式
Use the following information to answer the next four exercises. Height (in inches) and weight (In pounds) in a sample of college students have a linear relationship with the following summary statistics:
= 68.4
=141.6
sx = 4.0
sy = 9.6
r = 0.73
Let Y = weight and X = height, and write the regression equation in the form:
= 68.4
=141.6
sx = 4.0
sy = 9.6
r = 0.73
Let Y = weight and X = height, and write the regression equation in the form:
次の情報を用いて、続く4問に答えよ。大学生の標本の身長(インチ)と体重(ポンド)には線形関係があり、要約統計量は次のとおりである。 = 68.4、 = 141.6、sx = 4.0、sy = 9.6、r = 0.73。Y = 体重、X = 身長として、 の形で回帰式を書け。
13. What is the value of the slope?
13。傾きはいくつか。
14. What is the value of the y intercept?
14。y切片はいくつか。
15. Write the regression equation predicting weight from height in this data set, and calculate the predicted weight for someone 68 inches tall.
15。このデータで身長から体重を予測する回帰式を書き、身長68インチの人の予測体重を計算せよ。
12.5: Correlation Coefficient and Coefficient of Determination12.5:相関係数と決定係数
16. The correlation between body weight and fuel efficiency (measured as miles per gallon) for a sample of 2,012 model cars is –0.56. Calculate the coefficient of determination for this data and explain what it means.
16。2012年モデルの自動車の標本について、車体重量と燃費(1ガロン当たりの走行マイル数)の相関は −0.56 である。決定係数を計算し、意味を説明せよ。
17. The correlation between high school GPA and first-year college GPA for a sample of 200 university students is 0.32. How much variation in first-year college GPA is not explained by high school GPA?
17。大学生200人の標本で、高校のGPAと大学1年次のGPAの相関は0.32である。大学1年次のGPAの変動のうち、高校のGPAで説明できない部分はどのくらいか。
18. Rounded to two decimal places what correlation between two variables is necessary to have a coefficient of determination of at least 0.50?
18。決定係数を少なくとも0.50にするには、2変数間の相関はどのくらい必要か。小数第3位を四捨五入し、小数第2位まで答えよ。
12.6: Testing the Significance of the Correlation Coefficient12.6:相関係数の有意性の検定
19. Write the null and alternative hypotheses for a study to determine if two variables are significantly correlated.
19。2変数に有意な相関があるかを調べる研究の、帰無仮説と対立仮説を書け。
20. In a sample of 30 cases, two variables have a correlation of 0.33. Do a t-test to see if this result is significant at the α = 0.05 level. Use the formula:
20。30例の標本で、2変数の相関は0.33だった。α = 0.05 で有意かを t検定で調べよ。公式 を使うこと。
21. In a sample of 25 cases, two variables have a correlation of 0.45. Do a t-test to see if this result is significant at the α = 0.05 level. Use the formula:
21。25例の標本で、2変数の相関は0.45だった。α = 0.05 で有意かを t検定で調べよ。公式 を使うこと。
12.7: Prediction12.7:予測
Use the following information to answer the next two exercises. A study relating the grams of potassium (Y) to the grams of fiber (X) per serving in enriched flour products (bread, rolls, etc.) produced the equation:
英語のヒント
次の情報を用いて、続く2問に答えよ。栄養強化小麦粉を使った製品(パン、ロールパンなど)について、1食分のカリウム量 Y(グラム)と食物繊維量 X(グラム)の関係を調べたところ、式 が得られた。
22. For a product with five grams of fiber per serving, what are the expected grams of potassium per serving?
22。1食分に食物繊維を5グラム含む製品では、カリウムは何グラム含まれると予想されるか。
23. Comparing two products, one with three grams of fiber per serving and one with six grams of fiber per serving, what is the expected difference in grams of potassium per serving?
23。1食分の食物繊維量が3グラムの製品と6グラムの製品を比べると、カリウム量は何グラム違うと予想されるか。
12.8: Outliers12.8:外れ値
24. In the context of regression analysis, what is the definition of an outlier, and what is a rule of thumb to evaluate if a given value in a data set is an outlier?
英語のヒント
24。回帰分析における外れ値の定義と、データ集合の値が外れ値かどうか判断する目安を述べよ。
25. In the context of regression analysis, what is the definition of an influential point, and how does an influential point differ from an outlier?
25。回帰分析における影響の強い点の定義を述べ、外れ値との違いを説明せよ。
26. The least squares regression line for a data set is and the standard deviation of the residuals is 0.4. Does a case with the values x = 2, y = 6.2 qualify as an outlier?
26。あるデータの最小二乗回帰直線は 、残差の標準偏差は0.4である。x = 2、y = 6.2 の点は外れ値に当たるか。
27. The least squares regression line for a data set is and the standard deviation of the residuals is 0.13. Does a case with the values x = 4.1, y = 2.34 qualify as an outlier?
27。あるデータの最小二乗回帰直線は 、残差の標準偏差は0.13である。x = 4.1、y = 2.34 の点は外れ値に当たるか。
13.1: One-Way ANOVA13.1:一元配置分散分析
28. What are the five basic assumptions to be met if you want to do a one-way ANOVA?
28。一元配置分散分析を行うために満たすべき、五つの基本的な仮定は何か。
29. You are conducting a one-way ANOVA comparing the effectiveness of four drugs in lowering blood pressure in hypertensive patients. What are the null and alternative hypotheses for this study?
29。高血圧患者の血圧を下げる4種類の薬の効果を、一元配置分散分析で比較する。この研究の帰無仮説と対立仮説は何か。
30. What is the primary difference between the independent samples t-test and one-way ANOVA?
30。独立2標本の t検定と一元配置分散分析の主な違いは何か。
31. You are comparing the results of three methods of teaching geometry to high school students. The final exam scores X1, X2, X3, for the samples taught by the different methods have the following distributions:
X1 ~ N(85, 3.6)
X1 ~ N(82, 4.8)
X1 ~ N(79, 2.9)
Each sample includes 100 students, and the final exam scores have a range of 0–100. Assuming the samples are independent and randomly selected, have the requirements for conducting a one-way ANOVA been met? Explain why or why not for each assumption.
X1 ~ N(85, 3.6)
X1 ~ N(82, 4.8)
X1 ~ N(79, 2.9)
Each sample includes 100 students, and the final exam scores have a range of 0–100. Assuming the samples are independent and randomly selected, have the requirements for conducting a one-way ANOVA been met? Explain why or why not for each assumption.
31。高校生に幾何学を教える三つの方法の結果を比較している。それぞれの方法で学んだ標本の期末試験の得点 X1、X2、X3 は、X1 ~ N(85, 3.6)、X1 ~ N(82, 4.8)、X1 ~ N(79, 2.9) に従う。各標本には100人の生徒がおり、得点の範囲は0~100である。標本が独立で無作為に選ばれているとすると、一元配置分散分析の条件は満たされているか。各仮定について理由を説明せよ。
32. You conduct a study comparing the effectiveness of four types of fertilizer to increase crop yield on wheat farms. When examining the sample results, you find that two of the samples have an approximately normal distribution, and two have an approximately uniform distribution. Is this a violation of the assumptions for conducting a one-way ANOVA?
32。小麦農場の収量を増やす4種類の肥料の効果を比較している。標本を調べると、二つはおよそ正規分布、二つはおよそ一様分布だった。これは一元配置分散分析の仮定への違反か。