付録
Chapter 12第12章
Use the following information to answer the next two exercises: A recent survey of U.S. teenage pregnancy was answered by 720 girls, age 12–19. Six percent of the girls surveyed said they have been pregnant. We are interested in the true proportion of U.S. girls, age 12–19, who have been pregnant.
次の情報を用いて、続く2問に答えよ。米国の10代の妊娠に関する最近の調査に、12~19歳の女子720人が回答した。回答者の6%が妊娠経験があると答えた。米国の12~19歳の女子のうち、妊娠経験がある人の真の割合に関心がある。
123. Find the 95% confidence interval for the true proportion of U.S. girls, age 12–19, who have been pregnant.
123。米国の12~19歳の女子で、妊娠経験がある人の真の割合について、95%信頼区間を求めよ。
124. The report also stated that the results of the survey are accurate to within ±3.7% at the 95% confidence level. Suppose that a new study is to be done. It is desired to be accurate to within 2% of the 95% confidence level. What is the minimum number that should be surveyed?
英語のヒント
124。この報告は、調査結果の誤差が信頼水準95%で ±3.7% 以内であるとも述べている。新しい調査を行い、信頼水準95%で誤差を2%以内にしたいとする。必要な最小調査人数はいくつか。
125. Given: X ~ Exp. Sketch the graph that depicts: P(x > 1).
125。X ~ Exp とする。P(x > 1) を表すグラフの概形を描け。
Use the following information to answer the next three exercises: The amount of money a customer spends in one trip to the supermarket is known to have an exponential distribution. Suppose the mean amount of money a customer spends in one trip to the supermarket is $72.
次の情報を用いて、続く3問に答えよ。客がスーパーマーケットで1回の買い物に使う金額は、指数分布に従うことがわかっている。1回の平均支出額を72ドルとする。
126. Find the probability that one customer spends less than $72 in one trip to the supermarket?
126。客1人が1回の買い物に使う金額が72ドル未満である確率を求めよ。
127. Suppose five customers pool their money. How much money altogether would you expect the five customers to spend in one trip to the supermarket (in dollars)?
英語のヒント
127。5人の客がお金を持ち寄るとする。5人が1回の買い物で使う合計金額はいくらと予想されるか。ドル単位で答えよ。
128. State the distribution to use if you want to find the probability that the mean amount spent by five customers in one trip to the supermarket is less than $60.
128。5人の客が1回の買い物で使う平均金額が60ドル未満である確率を求めるには、どの分布を使うか。
Chapter 13第13章
Use the following information to answer the next two exercises: Suppose that the probability of a drought in any independent year is 20%. Out of those years in which a drought occurs, the probability of water rationing is 10%. However, in any year, the probability of water rationing is 5%.
英語のヒント
次の情報を用いて、続く2問に答えよ。各年は独立で、干ばつが起きる確率は20%とする。干ばつが起きた年に給水制限が行われる確率は10%である。一方、任意の年に給水制限が行われる確率は5%である。
129. What is the probability of both a drought and water rationing occurring?
129。干ばつと給水制限が両方起きる確率はいくつか。
130. Out of the years with water rationing, find the probability that there is a drought.
130。給水制限が行われた年に、干ばつが起きている確率を求めよ。
Use the following information to answer the next three exercises:
次の情報を用いて、続く3問に答えよ。
Apple リンゴ |
Pumpkin カボチャ |
Pecan ピーカンナッツ |
|
|---|---|---|---|
Female 女性 |
40 |
10 |
30 |
Male 男性 |
20 |
30 |
10 |
131. Suppose that one individual is randomly chosen. Find the probability that the person’s favorite pie is apple or the person is male.
131。1人を無作為に選ぶとする。その人が最も好きなパイはアップルパイである、またはその人が男性である確率を求めよ。
132. Suppose that one male is randomly chosen. Find the probability his favorite pie is pecan.
132。男性1人を無作為に選ぶとする。最も好きなパイがピーカンパイである確率を求めよ。
133. Conduct a hypothesis test to determine if favorite pie type and gender are independent.
133。最も好きなパイの種類と性別が独立かどうか、仮説検定を行え。
Use the following information to answer the next two exercises: Let’s say that the probability that an adult watches the news at least once per week is 0.60.
次の情報を用いて、続く2問に答えよ。成人が少なくとも週1回ニュースを見る確率を0.60とする。
134. We randomly survey 14 people. On average, how many people do we expect to watch the news at least once per week?
134。14人を無作為に調査する。平均して何人が少なくとも週1回ニュースを見ると予想されるか。
135. We randomly survey 14 people. Of interest is the number that watch the news at least once per week. State the distribution of X. X ~ _____
135。14人を無作為に調査する。少なくとも週1回ニュースを見る人数に関心がある。X の分布を示せ。X ~ _____
136. The following histogram is most likely to be a result of sampling from which distribution?
136。次のヒストグラムは、どの分布から標本を抽出した結果である可能性が最も高いか。
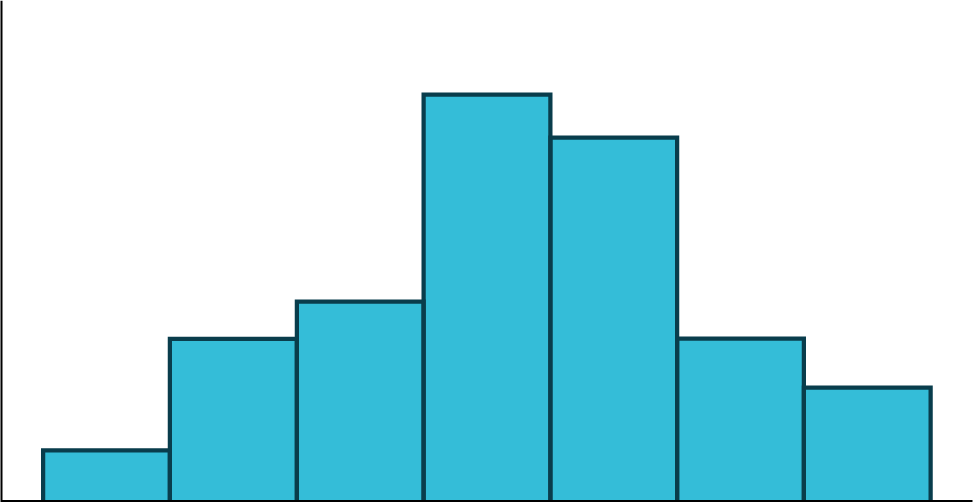
Figure A.6図 A.6
- Chi-Squareカイ二乗分布
- Geometric幾何分布
- Uniform一様分布
- Binomial二項分布
137. The ages of De Anza evening students is known to be normally distributed with a population mean of 40 and a population standard deviation of six. A sample of six De Anza evening students reported their ages (in years) as: 28; 35; 47; 45; 30; 50. Find the probability that the mean of six ages of randomly chosen students is less than 35 years. Hint: Find the sample mean.
137。デアンザの夜間学生の年齢は、母平均40歳、母標準偏差6歳の正規分布に従うことがわかっている。夜間学生6人の標本が回答した年齢は、28、35、47、45、30、50歳だった。無作為に選んだ学生6人の平均年齢が35歳未満である確率を求めよ。ヒント:標本平均を求める。
138. A math exam was given to all the fifth grade children attending Country School. Two random samples of scores were taken. The null hypothesis is that the mean math scores for boys and girls in fifth grade are the same. Conduct a hypothesis test.
138。カントリー・スクールの5年生全員に数学の試験を行い、得点から2つの無作為標本を取った。帰無仮説は、5年生の男子と女子の数学の平均得点が等しい、である。仮説検定を行え。
n |
s2 |
||
|---|---|---|---|
Boys 男子 |
55 |
82 |
29 |
Girls 女子 |
60 |
86 |
46 |
139. In a survey of 80 males, 55 had played an organized sport growing up. Of the 70 females surveyed, 25 had played an organized sport growing up. We are interested in whether the proportion for males is higher than the proportion for females. Conduct a hypothesis test.
139。男性80人を調べたところ、55人が成長期に組織的なスポーツ活動に参加した経験があった。女性70人では25人に経験があった。男性の割合が女性の割合より高いかどうかに関心がある。仮説検定を行え。
140. Which of the following is preferable when designing a hypothesis test?
140。仮説検定を設計するとき、望ましいのはどれか。
- Maximize α and minimize βα を最大にし、β を最小にする。
- Minimize α and maximize βα を最小にし、β を最大にする。
- Maximize α and βα と β を最大にする。
- Minimize α and βα と β を最小にする。
Use the following information to answer the next three exercises: 120 people were surveyed as to their favorite beverage (non-alcoholic). The results are below.
次の情報を用いて、続く3問に答えよ。120人に好きな飲み物(アルコール飲料を除く)を尋ねた。結果は次のとおりである。
Beverage/Age 飲み物/年齢 |
0–9 |
10–19 |
20–29 |
30+ |
Totals 合計 |
|---|---|---|---|---|---|
Milk 牛乳 |
14 |
10 |
6 |
0 |
30 |
Soda 炭酸飲料 |
3 |
8 |
26 |
15 |
52 |
Juice ジュース |
7 |
12 |
12 |
7 |
38 |
Totals 合計 |
24 |
330 |
44 |
22 |
120 |
141. Are the events of milk and 30+:
141。牛乳を好むことと30歳以上であることについて、次を答えよ。
- independent events? Justify your answer.独立な事象か。答えの根拠を示せ。
- mutually exclusive events? Justify your answer.互いに排反な事象か。答えの根拠を示せ。
142. Suppose that one person is randomly chosen. Find the probability that person is 10–19 given that they prefer juice.
142。1人を無作為に選ぶとする。その人がジュースを好むという条件のもとで、10~19歳である確率を求めよ。
143. Are “Preferred Beverage” and “Age” independent events? Conduct a hypothesis test.
143。「好きな飲み物」と「年齢」は独立な事象か。仮説検定を行え。
144. Given the following histogram, which distribution is the data most likely to come from?
144。次のヒストグラムが与えられたとき、データの抽出元として最も可能性が高いのはどの分布か。
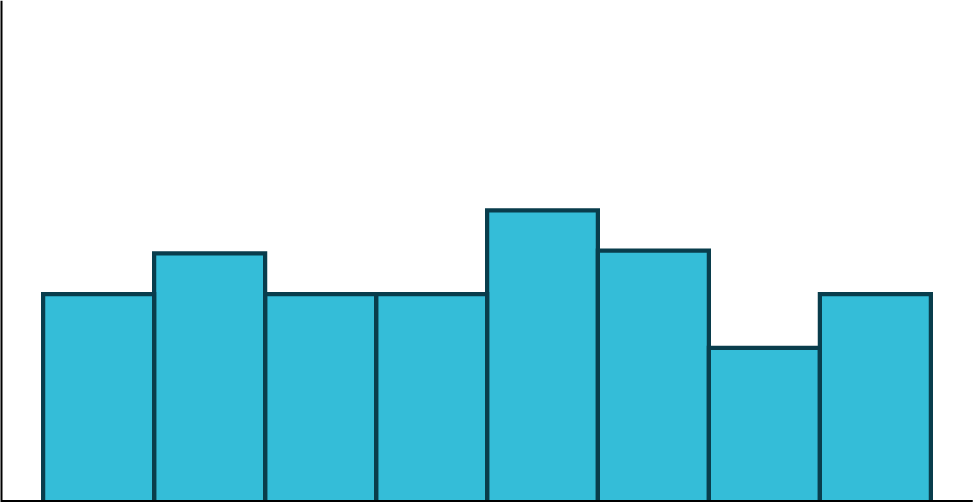


Figure A.7図 A.7
- uniform一様分布
- exponential指数分布
- normal正規分布
- chi-squareカイ二乗分布