付録
13.2: The F Distribution13.2:F分布
Use the following information to answer the next seven exercises. You are conducting a study of three types of feed supplements for cattle to test their effectiveness in producing weight gain among calves whose feed includes one of the supplements. You have four groups of 30 calves (one is a control group receiving the usual feed, but no supplement). You will conduct a one-way ANOVA after one year to see if there are difference in the mean weight for the four groups.
英語のヒント
次の情報を用いて、続く7問に答えよ。牛用の3種類の飼料添加物について、子牛の体重を増やす効果を調べる。各30頭の4群を用意し、そのうち1群は添加物を与えず、通常の飼料だけを与える対照群とする。1年後に一元配置分散分析を行い、4群の平均体重に差があるかを調べる。
33. What is SSwithin in this experiment, and what does it mean?
33。この実験の SSwithin は何で、何を意味するか。
34. What is SSbetween in this experiment, and what does it mean?
34。この実験の SSbetween は何で、何を意味するか。
35. What are k and i for this experiment?
35。この実験の k と i は何か。
36. If SSwithin = 374.5 and SStotal = 621.4 for this data, what is SSbetween?
36。このデータで SSwithin = 374.5、SStotal = 621.4 なら、SSbetween はいくつか。
37. What are MSbetween, and MSwithin, for this experiment?
37。この実験の MSbetween と MSwithin はいくつか。
38. What is the F Statistic for this data?
38。このデータの F統計量はいくつか。
39. If there had been 35 calves in each group, instead of 30, with the sums of squares remaining the same, would the F Statistic be larger or smaller?
39。平方和が同じまま、各群の子牛が30頭ではなく35頭だったとしたら、F統計量は大きくなるか、小さくなるか。
13.3: Facts About the F Distribution13.3:F分布の性質
40. Which of the following numbers are possible F Statistics?
40。次の数値のうち、F統計量としてありうるものはどれか。
- 2.47
- 5.95
- –3.61
- 7.28
- 0.97
41. Histograms F1 and F2 below display the distribution of cases from samples from two populations, one distributed F3,15 and one distributed F5,500. Which sample came from which population?
41。下のヒストグラム F1 と F2 は、それぞれ F3,15 と F5,500 に従う二つの母集団から取った標本の分布を示している。各標本はどちらの母集団から来たものか。
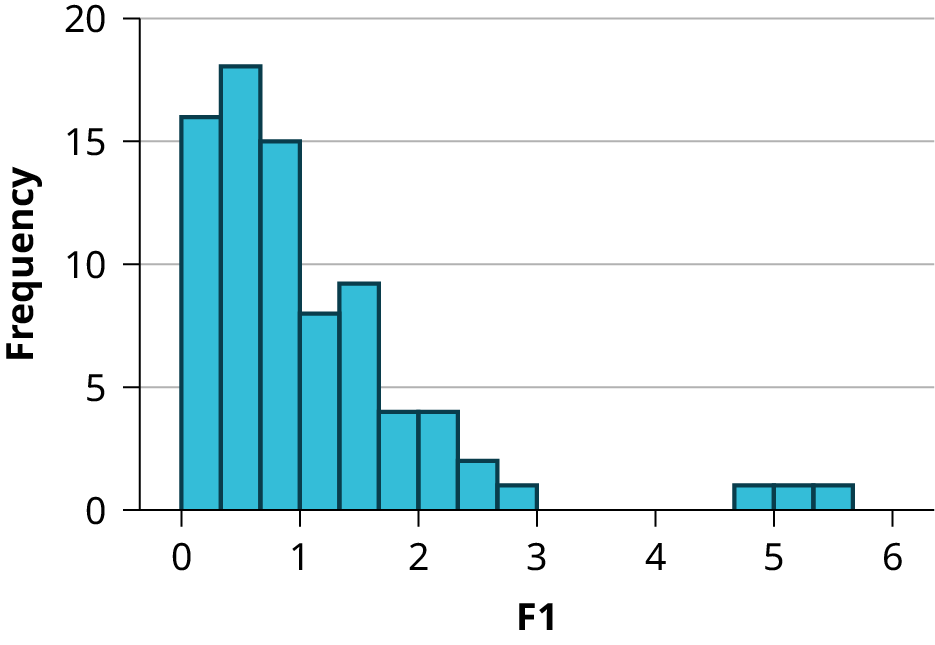
Figure B.8図 B.8
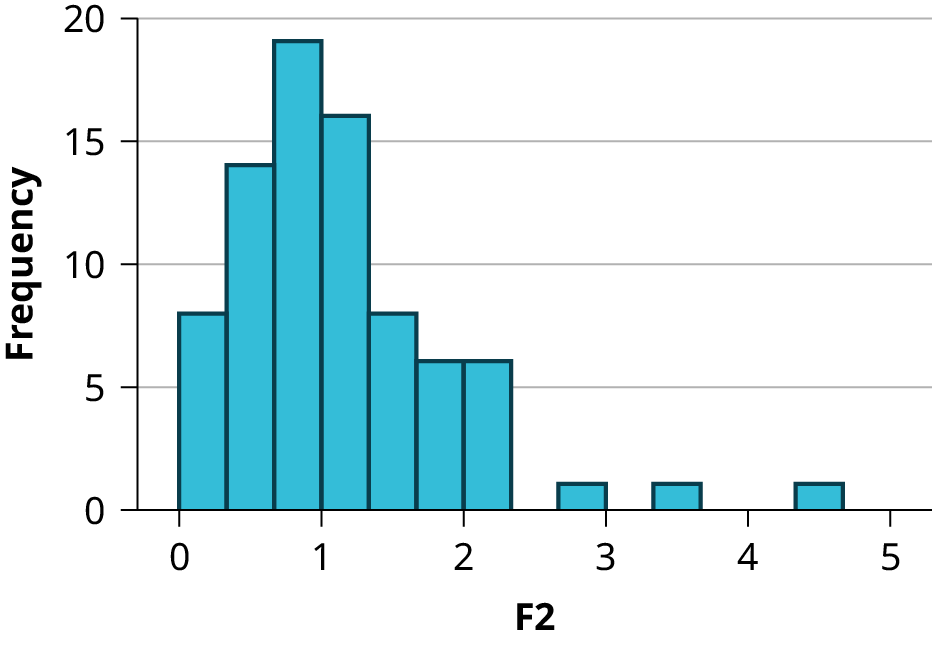


Figure B.9図 B.9
42. The F Statistic from an experiment with k = 3 and n = 50 is 3.67. At α = 0.05, will you reject the null hypothesis?
42。k = 3、n = 50 の実験の F統計量は3.67である。α = 0.05 で帰無仮説を棄却するか。
43. The F Statistic from an experiment with k = 4 and n = 100 is 4.72. At α = 0.01, will you reject the null hypothesis?
43。k = 4、n = 100 の実験の F統計量は4.72である。α = 0.01 で帰無仮説を棄却するか。
13.4: Test of Two Variances13.4:二つの分散の検定
44. What assumptions must be met to perform the F test of two variances?
44。二つの分散の F検定を行うには、どの仮定を満たす必要があるか。
45. You believe there is greater variance in grades given by the math department at your university than in the English department. You collect all the grades for undergraduate classes in the two departments for a semester, and compute the variance of each, and conduct an F test of two variances. What are the null and alternative hypotheses for this study?
45。自分の大学では、数学系の授業の成績の分散は英語系の授業より大きいと考えている。両部門のある学期の学部授業の成績をすべて集め、それぞれの分散を計算して、二つの分散の F検定を行う。この研究の帰無仮説と対立仮説は何か。
Practice Test 4 Solutions模擬試験4の解答
12.1 Linear Equations12.1:一次方程式
1. e. A, B, and C.
All three are linear equations of the form y = mx + b.
All three are linear equations of the form y = mx + b.
1。e。A、B、C。三つとも y = mx + b の形の一次方程式である。
2. Let y = the total number of hours required, and x the square footage, measured in units of 1,000. The equation is: y = x + 4
2。y = 必要な総時間、x = 1000平方フィートを単位とする面積、とする。方程式は y = x + 4。
3. Let y = the total payment, and x the number of students in a class. The equation is: y = 100(x) + 2,000
3。y = 支払総額、x = クラスの学生数、とする。方程式は y = 100(x) + 2000。
4. Let y = the total cost of attendance, and x the number of years enrolled. The equation is: y = 3,000(x) + 500
4。y = 通学の総費用、x = 在籍年数、とする。方程式は y = 3000(x) + 500。
12.2: Slope and Y-intercept of a Linear Equation12.2:一次方程式の傾きと y切片
5. The independent variable is the hours worked on a car. The dependent variable is the total labor charges to fix a car.
5。独立変数は車の作業時間、従属変数は修理の総工賃である。
6. Let y = the total charge, and x the number of hours required. The equation is: y = 55x + 75
The slope is 55 and the intercept is 75.
The slope is 55 and the intercept is 75.
6。y = 請求総額、x = 必要な時間、とする。方程式は y = 55x + 75。傾きは55、切片は75である。
7. y = 55(3.5) + 75 = 267.50
7。y = 55(3.5) + 75 = 267.50
8. Because the intercept is included in both equations, while you are only interested in the difference in costs, you do not need to include the intercept in the solution. The difference in number of hours required is: 6.3 – 2.4 = 3.9.
Multiply this difference by the cost per hour: 55(3.9) = 214.5.
The difference in cost between the two jobs is $214.50.
Multiply this difference by the cost per hour: 55(3.9) = 214.5.
The difference in cost between the two jobs is $214.50.
8。どちらの式にも切片が含まれ、知りたいのは費用の差だけなので、計算に切片を入れる必要はない。必要時間の差は 6.3 − 2.4 = 3.9。これに1時間当たりの費用を掛けると、55(3.9) = 214.5。二つの仕事の費用の差は214.50ドルである。
12.3: Scatter Plots12.3:散布図
9. The X and Y variables have a strong linear relationship. These variables would be good candidates for analysis with linear regression.
9。変数 X と Y には強い線形関係がある。線形回帰による分析に適している。
10. The X and Y variables have a strong negative linear relationship. These variables would be good candidates for analysis with linear regression.
10。変数 X と Y には強い負の線形関係がある。線形回帰による分析に適している。
11. There is no clear linear relationship between the X and Y variables, so they are not good candidates for linear regression.
11。変数 X と Y に明確な線形関係はないため、線形回帰に適していない。
12. The X and Y variables have a strong positive relationship, but it is curvilinear rather than linear. These variables are not good candidates for linear regression.
英語のヒント
12。変数 X と Y には強い正の関係があるが、直線的ではなく曲線的である。線形回帰に適していない。