第31章政府借入の影響
31.4 Fiscal Policy, Investment, and Economic Growth31.4 財政政策、投資、経済成長
Learning Objectives学習目標
Learning Objectives学習目標
By the end of this section, you will be able to:
英語のヒント
この節を学ぶと、次のことができるようになる。
- Explain crowding out and its effect on physical capital investment
英語のヒント
クラウディング・アウトと、それが実物資本投資に及ぼす影響を説明する - Explain the relationship between budget deficits and interest rates
英語のヒント
財政赤字と金利の関係を説明する - Identify why economic growth is tied to investments in physical capital, human capital, and technology
英語のヒント
経済成長が実物資本、人的資本、技術への投資と結び付いている理由を特定する
The underpinnings of economic growth are investments in physical capital, human capital, and technology, all set in an economic environment where firms and individuals can react to the incentives provided by well-functioning markets and flexible prices. Government borrowing can reduce the financial capital available for private firms to invest in physical capital. However, government spending can also encourage certain elements of long-term growth, such as spending on roads or water systems, on education, or on research and development that creates new technology.
英語のヒント
経済成長の基盤は、実物資本、人的資本、技術への投資である。それらはすべて、十分に機能する市場と柔軟な価格が提供する誘因に、企業と個人が反応できる経済環境の中に置かれる。政府借入れは、民間企業が実物資本に投資するために利用できる金融資本を減らしうる。しかし、政府支出は、道路や水道、教育、新技術を生む研究開発への支出など、長期的な成長のある要素を促進することもできる。
Crowding Out Physical Capital Investment実物資本投資のクラウディング・アウト
A larger budget deficit will increase demand for financial capital. If private saving and the trade balance remain the same, then less financial capital will be available for private investment in physical capital. When government borrowing soaks up available financial capital and leaves less for private investment in physical capital, economists call the result crowding out.
英語のヒント
財政赤字の拡大は金融資本の需要を増やす。民間貯蓄と貿易収支が同じままなら、実物資本への民間投資に利用できる金融資本は減る。政府借入れが利用可能な金融資本を吸い上げ、実物資本への民間投資に残る分を減らすとき、経済学者はその結果をクラウディング・アウトと呼ぶ。
To understand the potential impact of crowding out, consider the U.S. economy's situation before the exceptional circumstances of the recession that started in late 2007. In 2005, for example, the budget deficit was roughly 3% of GDP. Private investment by firms in the U.S. economy has hovered in the range of 14% to 18% of GDP in recent decades. However, in any given year, roughly half of U.S. investment in physical capital just replaces machinery and equipment that has worn out or become technologically obsolete. Only about half represents an increase in the total quantity of physical capital in the economy. Investment in new physical capital in any year is about 7% to 9% of GDP. In this situation, even U.S. budget deficits in the range of 3% of GDP can potentially crowd out a substantial share of new investment spending. Conversely, a smaller budget deficit (or an increased budget surplus) increases the pool of financial capital available for private investment.
英語のヒント
クラウディング・アウトがもたらしうる影響を理解するため、2007年末に始まった景気後退の例外的な状況以前の、アメリカ経済を考えよう。たとえば2005年には、財政赤字はGDPの約3%だった。アメリカ経済における企業の民間投資は、ここ数十年間、GDPの14~18%の範囲で推移してきた。しかし、どの年でも、アメリカの実物資本投資のおよそ半分は、摩耗したり技術的に旧式になったりした機械や設備を置き換えるだけである。経済全体の実物資本の総量の増加となるのは、約半分にすぎない。どの年でも、新しい実物資本への投資はGDPの約7~9%である。この状況では、GDPの3%程度のアメリカの財政赤字でも、新規投資支出のかなりの部分をクラウディング・アウトする可能性がある。逆に、財政赤字の縮小(または財政黒字の増加)は、民間投資に利用できる金融資本の蓄えを増やす。
Additional Resources追加教材
Figure 31.7 shows the patterns of U.S. budget deficits and private investment since 1980. If greater government deficits lead to less private investment in physical capital, and reduced government deficits or budget surpluses lead to more investment in physical capital, these two lines should move up and down simultaneously. This pattern occurred in the late 1990s and early 2000s. The U.S. federal budget went from a deficit of 2.2% of GDP in 1995 to a budget surplus of 2.4% of GDP in 2000—a swing of 4.6% of GDP. From 1995 to 2000, private investment in physical capital rose from 15% to 18% of GDP—a rise of 3% of GDP. Then, when the U.S. government again started running budget deficits in the early 2000s, less financial capital became available for private investment, and the rate of private investment fell back to about 15% of GDP by 2003. However, in more recent years, in the 2010s after the economy recovered from the Great Recession, private investment as a share of GDP increased even as deficits slightly worsened, especially around 2016. And while the deficit increased substantially in 2020, private investment as a share of GDP did not.
英語のヒント
図31.7は、1980年以降のアメリカの財政赤字と民間投資の推移を示す。政府の赤字が増えると実物資本への民間投資が減り、政府の赤字の減少や財政黒字が実物資本投資を増やすなら、この二つの線は同時に上下するはずである。この動きは、1990年代後半と2000年代初頭に見られた。アメリカ連邦財政は、1995年のGDP比2.2%の赤字から、2000年のGDP比2.4%の黒字へ変わり、GDP比4.6%の変動となった。1995年から2000年に、実物資本への民間投資はGDP比15%から18%へ上がり、GDP比3%の増加となった。その後、2000年代初頭にアメリカ政府が再び財政赤字を出し始めると、民間投資に利用できる金融資本が減り、民間投資の比率は2003年までにGDPの約15%へ戻った。しかし、より近年の、大景気後退から経済が回復した後の2010年代には、とくに2016年前後、赤字がわずかに悪化しても民間投資のGDP比は上昇した。また、2020年には赤字が大幅に増えたが、民間投資のGDP比はそうならなかった。
U.S. Budget Deficits/Surpluses and Private Investmentアメリカの財政赤字・黒字と民間投資
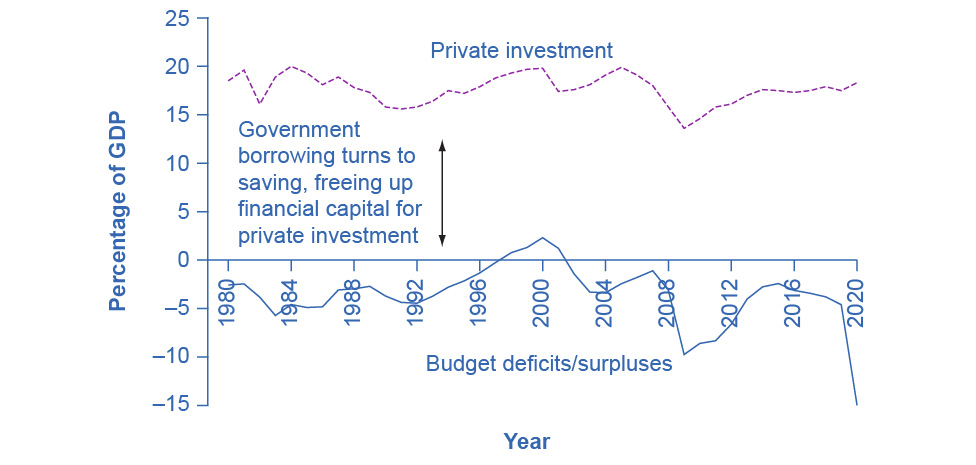

Figure 31.7図 31.7
The connection between private savings and flows of international capital plays a role in budget deficits and surpluses. Consequently, government borrowing and private investment sometimes rise and fall together. For example, the 1990s show a pattern in which reduced government borrowing helped to reduce crowding out so that more funds were available for private investment.
英語のヒント
民間貯蓄と国際資本移動のつながりは、財政赤字や黒字に影響する。その結果、政府借入れと民間投資は、時として一緒に増減する。たとえば1990年代には、政府借入れの減少がクラウディング・アウトを減らし、民間投資に利用できる資金を増やすという動きが見られる。
This argument does not claim that a government's budget deficits will exactly shadow its national rate of private investment; after all, we must account for private saving and inflows of foreign financial investment. In the mid-1980s, for example, government budget deficits increased substantially without a corresponding drop off in private investment. In 2009, nonresidential private fixed investment dropped by $300 billion from its previous level of $1,941 billion in 2008, primarily because, during a recession, firms lack both the funds and the incentive to invest. Investment growth between 2009 and 2014 averaged approximately 5.9% to $2,210.5 billion—only slightly above its 2008 level, according to the Bureau of Economic Analysis. During that same period, interest rates dropped from 3.94% to less than a quarter percent as the Federal Reserve took dramatic action to prevent a depression by increasing the money supply through lowering short-term interest rates. The "crowding out" of private investment due to government borrowing to finance expenditures appears to have been suspended after the Great Recession.
英語のヒント
この議論は、政府の財政赤字が、その国の民間投資率とまったく同じ動きをする、と主張するものではない。結局、民間貯蓄と海外金融投資の流入を考慮しなければならない。たとえば1980年代半ばには、政府の財政赤字は大幅に増えたが、それに対応する民間投資の落ち込みはなかった。2009年には、非住宅民間固定投資は、2008年の1兆9,410億ドルという従来の水準から3,000億ドル減った。主因は、景気後退の間、企業には投資する資金も誘因も乏しいことである。経済分析局によると、2009年から2014年の投資の伸びは平均約5.9%で、2兆2,105億ドルとなり、2008年の水準をわずかに上回るにとどまった。同じ期間に、連邦準備制度が短期金利を引き下げて貨幣供給量を増やすことで恐慌を防ぐ大胆な措置を取ったため、金利は3.94%から0.25%未満へ下がった。支出を賄う政府借入れによる民間投資の「クラウディング・アウト」は、大景気後退後には停止していたように見える。