第32章世界のマクロ経済政策
32.1 The Diversity of Countries and Economies across the World32.1 世界の国々と経済の多様性
Learning Objectives学習目標
Learning Objectives学習目標
By the end of this section, you will be able to:
英語のヒント
この節を学ぶと、次のことができるようになる。
- Analyze GDP and GNI per capita as a measure of the diversity of international standards of living
英語のヒント
国際的な生活水準の多様性の尺度として、1人当たりGDPとGNIを分析する - Identify what classifies a country as low income, lower-middle income, upper-middle income, or high income
英語のヒント
低所得国、下位中所得国、上位中所得国、高所得国の分類基準を特定する - Explain how geography, demographics, industry structure, and economic institutions influence standards of living
英語のヒント
地理、人口構成、産業構造、経済制度が生活水準にどう影響するか説明する
The national economies that comprise the global economy are remarkably diverse. Let us use one key indicator of the standard of living, GDP per capita, to quantify this diversity. You will quickly see that quantifying this diversity is fraught with challenges and limitations. As we explained in The Macroeconomic Perspective, we must consider using purchasing power parity or “international dollars” to convert average incomes into comparable units. Purchasing power parity, as we formally defined in Exchange Rates and International Capital Flows, takes into account that prices of the same good are different across countries.
英語のヒント
世界経済を構成する各国経済は、驚くほど多様である。生活水準の重要な指標の一つである1人当たりGDPを使って、この多様性を数量化してみよう。多様性の数量化には困難や限界がつきまとうことが、すぐに分かる。「マクロ経済の視点」で説明したように、平均所得を比較可能な単位へ換算するには、購買力平価、すなわち「国際ドル」の使用を考えなければならない。「為替レートと国際資本移動」で正式に定義した購買力平価は、同じ財の価格が国によって異なることを考慮する。
The Macroeconomic Perspective explained how to measure GDP, the challenges of using GDP to compare standards of living, and the difficulty of confusing economic size with distribution. In China’s case, for example, China ranks as the second largest global economy, second to only the United States, with Japan ranking third. However, when we take China’s GDP of $9.2 trillion and divide it by its population of 1.4 billion, then the per capita GDP is only $6,900, which is significantly lower than that of Japan, at $38,500, and that of the United States, at $52,800. Measurement issues aside, it’s worth repeating that the goal, then, is to not only increase GDP, but to strive toward increased GDP per capita to increase overall living standards for individuals. As we have learned from Economic Growth, countries can achieve this at the national level by designing policies that increase worker productivity, deepen capital, and advance technology.
英語のヒント
「マクロ経済の視点」では、GDPの測定方法、生活水準の比較にGDPを使う際の難点、経済の規模と分配を混同する難しさを説明した。たとえば中国は、アメリカに次ぐ世界第2位の経済で、日本が第3位である。しかし、中国のGDP9兆2,000億ドルを人口14億人で割ると、1人当たりGDPはわずか6,900ドルであり、日本の3万8,500ドルやアメリカの5万2,800ドルより大幅に低い。測定上の問題はさておき、目標はGDPを増やすだけでなく、個人の全体的な生活水準を高めるため、1人当たりGDPの増加に努めることだと、繰り返しておく価値がある。「経済成長」で学んだように、労働者の生産性を上げ、資本を深化させ、技術を進歩させる政策を設計することで、国はこれを全国的に達成できる。
The related measure gross national income (GNI) per capita also allows us to rank countries into high-, upper-middle-, lower-middle-, or low-income groups. The World Bank updates the classifications each year. Low-income countries are those with $1,085 per capita GNI per year; lower-middle-income countries have a per capita GNI between $1,086 and $4,255; upper-middle-income countries have a per capita GDP between $4,265 and $13,205; while high-income countries have over $13,206 per year per capita income. According to the 2022 classifications, there are 27 low-income nations and 80 high-income nations. The other 110 measured nations occupy the two tiers of middle-income nations, and are comprised of the vast majority—75%, of the world’s population. Despite the population and quantitative majority, these nations only produce one third of global GNI and have nearly two-thirds of the world’s people living in poverty.
英語のヒント
関連する指標である1人当たり国民総所得(GNI)を使っても、国を高所得、上位中所得、下位中所得、低所得の各群に分類できる。世界銀行は毎年、この分類を更新している。低所得国は年間1人当たりGNIが1,085ドルの国、下位中所得国は1人当たりGNIが1,086~4,255ドル、上位中所得国は1人当たりGDPが4,265~1万3,205ドル、高所得国は年間1人当たり所得が1万3,206ドルを超える国である。2022年の分類では、低所得国は27か国、高所得国は80か国ある。測定対象の残り110か国は、中所得国の二つの区分に属し、世界人口の大多数、75%を占める。人口でも国の数でも多数を占めるが、これらの国は世界のGNIの3分の1しか生み出さず、世界の貧困状態にある人々の3分の2近くが暮らしている。
Income Group 所得群 |
GDP (in billions) GDP(10億ドル) |
% of Global GDP 世界GDPに占める割合(%) |
Population (millions) 人口(100万人) |
% of Global Population 世界人口に占める割合(%) |
|---|---|---|---|---|
Low income ($1,085 or less) 低所得(1,085ドル以下) |
$457.6 |
0.5% |
665.1 |
8.6% |
Lower- and upper-middle income ($1,086–$13,205) 下位・上位中所得(1,086~1万3,205ドル) |
$30,535 |
36.5% |
5,853 |
75.7% |
High income (more than $13,205) 高所得(1万3,205ドル超) |
$53,396 |
63% |
1,215 |
15.7% |
World Total income 世界の総所得 |
$84,388 |
7,773.1 |
Percent of Global GDP and Percent of Population世界GDPに占める割合と人口に占める割合
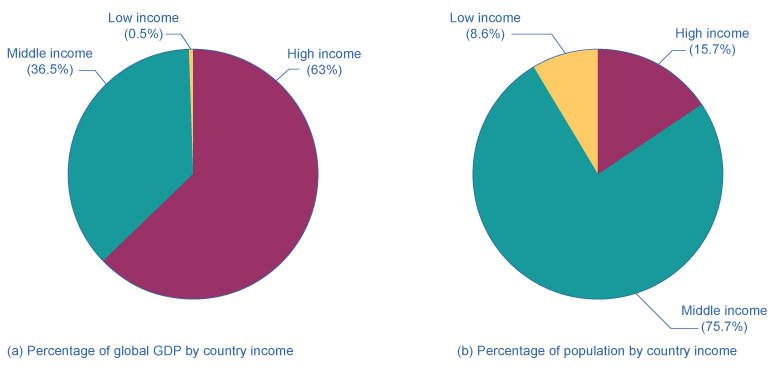

Figure 32.2図 32.2
The two pie charts show that low-income countries represent less than 1% of global income and make up 8.6% of global population. The combined middle-income countries represent 36.5% of income and make up 75.7% of global population. And the high-income countries have 63% of the world’s income and make up 15.7% of the population. (Source: https://data.worldbank.org/indicator/NY.GDP.MKTP.CD)
英語のヒント
二つの円グラフは、低所得国が世界所得の1%未満を占め、世界人口の8.6%を構成することを示す。中所得国を合計すると所得の36.5%を占め、世界人口の75.7%を構成する。高所得国は世界所得の63%を持ち、人口の15.7%を構成する。(出所:https://data.worldbank.org/indicator/NY.GDP.MKTP.CD)
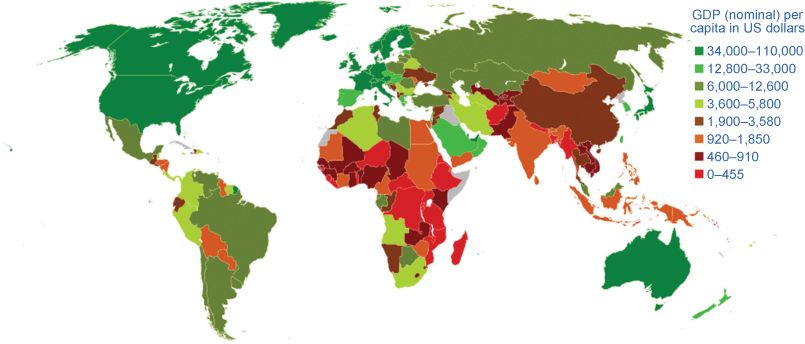
An overview of the regional averages of GDP per person for developing countries, measured in comparable international dollars as well as population in 2018 (Figure 32.3), shows that the differences across these regions are stark. As Table 32.2 shows, nominal GDP per capita in 2020 for the 652 million people living in Latin America and the Caribbean region (excluding high income countries in that region) was $6,799, which far exceeds that of South Asia and sub-Saharan Africa. In turn, people in the world’s high-income nations, such as those who live in the European Union nations or North America, have a per capita GDP three to four times that of the people of Latin America. To put things in perspective, North America and the European Union (plus the United Kingdom) have slightly more than 10% of the world’s population, but they produce and consume about 44% of the world’s GDP.
英語のヒント
比較可能な国際ドルで測った発展途上国の1人当たりGDPの地域平均と、2018年の人口を概観すると(図32.3)、地域間の違いが際立っていることが分かる。表32.2が示すように、ラテンアメリカ・カリブ海地域に住む6億5,200万人(地域内の高所得国を除く)の2020年の名目1人当たりGDPは6,799ドルで、南アジアやサハラ以南のアフリカを大きく上回る。さらに、EU諸国や北アメリカに住む人々など、世界の高所得国の人々の1人当たりGDPは、ラテンアメリカの人々の3~4倍である。比較のためにいえば、北アメリカとEU(およびイギリス)の人口は、世界人口の10%を少し上回るが、世界のGDPの約44%を生産し、消費している。
GDP Per Capita in U.S. Dollars米ドルで表した1人当たりGDP
Bsrboy, GDP (nominal) per capita map.png, Wikimedia Commons, released into the public domain by the creator. Modified in OpenStax Principles of Economics 3e. · Public Domain · Source出典

Figure 32.3図 32.3
There is a clear imbalance in the GDP across the world. North America, Australia, and Western Europe have the highest GDPs while large areas of the world have dramatically lower GDPs. Russia and other former Soviet nations, as well as Argentina, Botswana, Brazil, Chile, Gabon, and Mexico, have a mid-tier per capita GDP of about $6,000–10,000. China, though a major economic engine for the world, is about $10,500. Egypt, India, Indonesia, Mongolia, and Sudan are lower at about $920–3,500. (Credit: modification of work by Bsrboy/Wikimedia Commons)
英語のヒント
世界のGDPには明確な不均衡がある。北アメリカ、オーストラリア、西ヨーロッパのGDPが最も高い一方、世界の広い地域では劇的に低い。ロシアと他の旧ソ連諸国、アルゼンチン、ボツワナ、ブラジル、チリ、ガボン、メキシコは、約6,000~1万ドルという中位の1人当たりGDPを持つ。世界経済の主要な原動力である中国は、約1万500ドルである。エジプト、インド、インドネシア、モンゴル、スーダンは、それより低い約920~3,500ドルである。(クレジット:Bsrboy/Wikimedia Commonsの作品を改変)
Population (in millions) 人口(100万人) |
GDP Per Capita 1人当たりGDP |
|
|---|---|---|
East Asia and Pacific 東アジア・太平洋 |
2,361 |
$8,254 |
South Asia 南アジア |
1,857 |
$1,823.7 |
Sub-Saharan Africa サハラ以南のアフリカ |
1,136.7 |
$1,499.4 |
Latin America and Caribbean ラテンアメリカ・カリブ海 |
652 |
$6,799.2 |
Middle East and North Africa 中東・北アフリカ |
465 |
$3,018.4 |
Europe and Central Asia ヨーロッパ・中央アジア |
923 |
$7,688.5 |
Such comparisons between regions are admittedly rough. After all, per capita GDP cannot fully capture the quality of life. Many other factors have a large impact on the standard of living, like health, education, human rights, crime and personal safety, and environmental quality. These measures also reveal very wide differences in the standard of living across the regions of the world. Much of this is correlated with per capita income, but there are exceptions. For example, life expectancy at birth in many low-income regions approximates those who are more affluent. The data also illustrate that nobody can claim to have perfect standards of living. For instance, despite very high income levels, there is still undernourishment in Europe and North America.
英語のヒント
こうした地域間の比較が大まかなものであることは、認めざるを得ない。そもそも、1人当たりGDPは生活の質を完全には捉えられない。健康、教育、人権、犯罪や身の安全、環境の質のような、多くの他の要因が生活水準に大きく影響する。これらの尺度も、世界の各地域の生活水準に非常に大きな違いがあることを明らかにする。その多くは1人当たり所得と相関するが、例外もある。たとえば、多くの低所得地域の出生時平均余命は、より豊かな地域の人々の値に近い。データはまた、完璧な生活水準を持つと主張できる者はいないことも示す。たとえばヨーロッパと北アメリカでは、所得水準が非常に高いにもかかわらず、依然として栄養不足がある。
Additional Resources追加教材
The differences in economic statistics and other measures of well-being, substantial though they are, do not fully capture the reasons for the enormous differences between countries. Aside from the neoclassical determinants of growth, four additional determinants are significant in a wide range of statistical studies and are worth mentioning: geography, demography, industrial structure, and institutions.
英語のヒント
経済統計や他の福祉の尺度の違いは、大きいとはいえ、国どうしの膨大な違いの理由を完全には捉えていない。新古典派の成長決定要因に加え、幅広い統計研究で重要とされ、言及する価値がある追加の決定要因が四つある。地理、人口構成、産業構造、制度である。
Geographic and Demographic Differences
英語のヒント
地理と人口構成の違い
Countries have geographic differences: some have extensive coastlines, some are landlocked. Some have large rivers that have been a path of commerce for centuries, or mountains that have been a barrier to trade. Some have deserts, some have rain forests. These differences create different positive and negative opportunities for commerce, health, and the environment.
英語のヒント
国には地理的な違いがある。長い海岸線を持つ国もあれば、内陸国もある。何世紀もの間、商業の通り道となってきた大河を持つ国もあれば、貿易の障壁となってきた山々を持つ国もある。砂漠を持つ国も、熱帯雨林を持つ国もある。こうした違いは、商業、健康、環境にとって、プラス面とマイナス面で異なる機会を生む。
Countries also have considerable differences in the age distribution of the population. Many high-income nations are approaching a situation by 2020 or so in which the elderly will form a much larger share of the population. Most low-income countries still have a higher proportion of youth and young adults, but by about 2050, the elderly populations in these low-income countries are expected to boom as well. These demographic changes will have considerable impact on the standard of living of the young and the old.
英語のヒント
各国の人口の年齢分布にも、かなりの違いがある。多くの高所得国は、2020年頃までに、高齢者が人口のはるかに大きな割合を占める状況に近づいている。ほとんどの低所得国では、まだ若者や若年成人の割合が高いが、2050年頃には、これらの低所得国でも高齢人口が急増すると予想される。こうした人口構成の変化は、若者と高齢者の生活水準に大きな影響を与える。
Differences in Industry Structure and Economic Institutions
英語のヒント
産業構造と経済制度の違い
Countries have differences in industry structure. In the world’s high-income economies, only about 2% of GDP comes from agriculture; the average for the rest of the world is 12%. Countries have strong differences in degree of urbanization.
英語のヒント
各国の産業構造には違いがある。世界の高所得経済では、農業が生むGDPは約2%にすぎないが、それ以外の世界の平均は12%である。各国の都市化の程度には、大きな違いがある。
Countries also have strong differences in economic institutions: some nations have economies that are extremely market-oriented, while other nations have command economies. Some nations are open to international trade, while others use tariffs and import quotas to limit the impact of trade. Some nations are torn by long-standing armed conflicts; other nations are largely at peace. There are also differences in political, religious, and social institutions.
英語のヒント
各国の経済制度にも大きな違いがある。非常に市場志向の経済を持つ国もあれば、指令経済を持つ国もある。国際貿易に開かれた国もあれば、関税や輸入割当てを使って貿易の影響を制限する国もある。長年の武力紛争によって引き裂かれた国もあれば、概ね平和な国もある。政治・宗教・社会の制度にも違いがある。
No nation intentionally aims for a low standard of living, high rates of unemployment and inflation, or an unsustainable trade imbalance. However, nations will differ in their priorities and in the situations in which they find themselves, and so their policy choices can reasonably vary, too. The next modules will discuss how nations around the world, from high income to low income, approach the four macroeconomic goals of economic growth, low unemployment, low inflation, and a sustainable balance of trade.
英語のヒント
低い生活水準、高い失業率やインフレ率、持続不可能な貿易不均衡を意図的に目指す国はない。しかし、国によって優先順位も置かれた状況も異なるため、政策上の選択が異なるのももっともである。次の各節では、高所得国から低所得国まで、世界の国々が、経済成長、低失業、低インフレ、持続可能な貿易収支という四つのマクロ経済目標にどう取り組むかを論じる。