第6章消費者の選択
The Foundations of Demand Curves需要曲線の基礎
Changes in the price of a good lead the budget constraint to rotate. A rotation in the budget constraint means that when individuals are seeking their highest utility, the quantity that is demanded of that good will change. In this way, the logical foundations of demand curves—which show a connection between prices and quantity demanded—are based on the underlying idea of individuals seeking utility. Figure 6.5 (a) shows a budget constraint with a choice between housing and “everything else.” (Putting “everything else” on the vertical axis can be a useful approach in some cases, especially when the focus of the analysis is on one particular good.) We label the preferred choice on the original budget constraint that provides the highest possible utility M0. The other three budget constraints represent successively higher prices for housing of P1, P2, and P3. As the budget constraint rotates in, and in, and in again, we label the utility-maximizing choices M1, M2, and M3, and the quantity demanded of housing falls from Q0 to Q1 to Q2 to Q3.
英語のヒント
財の価格変化は予算制約を回転させる。予算制約が回転すると、最大の効用を求める個人の、その財に対する需要量が変わる。価格と需要量の関係を示す需要曲線の論理的基礎には、個人が効用を求めるという考えがある。図6.5(a)は、住宅と「その他すべて」の間での選択を示す予算制約だ。「その他すべて」を縦軸に置く方法は、特定の一つの財に注目するときに特に便利である。元の予算制約上で最大の効用を与える選択をM0とする。残る三つの予算制約は、住宅価格がP1、P2、P3と順に高くなる場合を表す。制約が繰り返し内側へ回転するにつれ、効用最大化の選択はM1、M2、M3となり、住宅需要量はQ0、Q1、Q2、Q3へ減っていく。
The Foundations of a Demand Curve: An Example of Housing需要曲線の基礎――住宅の例
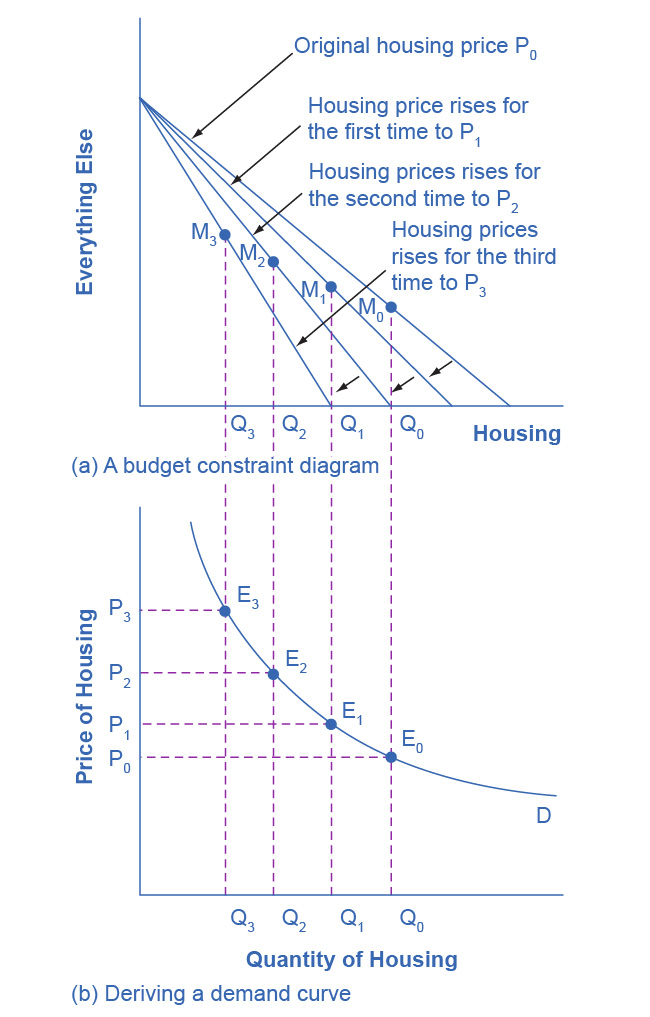

Figure 6.5図 6.5
(a) As the price increases from P0 to P1 to P2 to P3, the budget constraint on the upper part of the diagram rotates clockwise. The utility-maximizing choice changes from M0 to M1 to M2 to M3. As a result, the quantity demanded of housing shifts from Q0 to Q1 to Q2 to Q3, ceteris paribus. (b) The demand curve graphs each combination of the price of housing and the quantity of housing demanded, ceteris paribus. The quantities of housing are the same at the points on both (a) and (b). Thus, the original price of housing (P0) and the original quantity of housing (Q0) appear on the demand curve as point E0. The higher price of housing (P1) and the corresponding lower quantity demanded of housing (Q1) appear on the demand curve as point E1.
英語のヒント
(a)価格がP0、P1、P2、P3と上がるにつれ、上の図の予算制約は時計回りに回転する。効用最大化の選択はM0、M1、M2、M3へ変わる。その結果、ほかの条件が同じなら、住宅需要量はQ0、Q1、Q2、Q3へ移る。(b)需要曲線は、ほかの条件が同じ場合の、住宅価格と住宅需要量の各組み合わせを描いたものだ。(a)と(b)の対応する点の住宅量は同じである。元の住宅価格P0と数量Q0は、需要曲線上のE0に当たる。高い価格P1と、それに対応する少ない需要量Q1は、E1に当たる。
Thus, as the price of housing rises, the budget constraint rotates clockwise and the quantity consumed of housing falls, ceteris paribus (meaning, with all other things being the same). We graph this relationship—the price of housing rising from P0 to P1 to P2 to P3, while the quantity of housing demanded falls from Q0 to Q1 to Q2 to Q3—on the demand curve in Figure 6.5 (b). The vertical dashed lines stretching between the top and bottom of Figure 6.5 show that the quantity of housing demanded at each point is the same in both (a) and (b). We ultimately determine the shape of a demand curve by the underlying choices about maximizing utility subject to a budget constraint. While economists may not be able to measure “utils,” they can certainly measure price and quantity demanded.
英語のヒント
Applications in Government and Business政府と企業への応用
The budget constraint framework for making utility-maximizing choices offers a reminder that people can react to a change in price or income in a range of different ways. For example, in the winter months of 2005, costs for heating homes increased significantly in many parts of the country as prices for natural gas and electricity soared, due in large part to the disruption caused by Hurricanes Katrina and Rita. Some people reacted by reducing the quantity demanded of energy; for example, by turning down the thermostats in their homes by a few degrees and wearing a heavier sweater inside. Even so, many home heating bills rose, so people adjusted their consumption in other ways, too. As you learned in the chapter on Elasticity, the short run demand for home heating is generally inelastic. Each household cut back on what it valued least on the margin. For some it might have been some dinners out, or a vacation, or postponing buying a new refrigerator or a new car. Sharply higher energy prices can have effects beyond the energy market, leading to a widespread reduction in purchasing throughout the rest of the economy.
英語のヒント
効用最大化のための予算制約の枠組みは、人々が価格や所得の変化にさまざまな形で反応することを思い出させる。例えば2005年冬、ハリケーン・カトリーナとリタによる混乱を主因として、天然ガスと電力の価格が急騰し、国内の多くの地域で家庭の暖房費が大きく増えた。一部の人々は、室内の設定温度を数度下げ、厚いセーターを着るなどして、エネルギー需要量を減らした。それでも多くの家庭の暖房費は増えたため、ほかの消費も調整した。「弾力性」で学んだように、家庭暖房の短期需要は一般に非弾力的である。各家計は、限界的に最も価値が低いと考えるものを削った。外食や休暇を減らした人も、新しい冷蔵庫や車の購入を延期した人もいるだろう。エネルギーの大幅な値上がりは、その市場を越え、経済のほかの部分で広範な購入減少を引き起こしうる。
A similar issue arises when the government imposes taxes on certain products, such as on gasoline, cigarettes, and alcohol. Say that a tax on alcohol leads to a higher price at the liquor store. The higher price of alcohol causes the budget constraint to pivot left, and alcoholic beverage consumption is likely to decrease. However, people may also react to the higher price of alcoholic beverages by cutting back on other purchases. For example, they might cut back on snacks at restaurants like chicken wings and nachos. It would be unwise to assume that the liquor industry is the only one affected by the tax on alcoholic beverages. Read the next Clear It Up to learn about how who controls the household income influences buying decisions.
英語のヒント
政府がガソリン、たばこ、酒などに課税するときにも、似た問題が起きる。酒への税が酒販店の値上がりにつながったとしよう。酒の値上がりは予算制約を左へ回転させ、酒の消費は減りそうだ。しかし、人々はほかの買い物を減らして対応することもある。例えば、レストランで手羽先やナチョスなどの軽食を減らすかもしれない。酒の税に影響されるのは酒類産業だけだと決め付けるのは賢明ではない。次の「疑問を解く」では、家計所得を誰が管理するかが購入の決定にどう影響するかを見る。