第25章ケインズ派の視点
25.3 The Phillips Curve25.3 フィリップス曲線
Learning Objectives学習目標
Learning Objectives学習目標
By the end of this section, you will be able to:
英語のヒント
この節を学ぶと、次のことができるようになる。
- Explain the Phillips curve, noting its impact on the theories of Keynesian economics
英語のヒント
ケインズ経済学の理論への影響に注意しながら、フィリップス曲線を説明する - Graph a Phillips curve
英語のヒント
フィリップス曲線を描く - Identify factors that cause the instability of the Phillips curve
英語のヒント
フィリップス曲線の不安定性を生む要因を特定する - Analyze the Keynesian policy for reducing unemployment and inflation
英語のヒント
失業とインフレを減らすケインズ派の政策を分析する
The simplified AD/AS model that we have used so far is fully consistent with Keynes’s original model. More recent research, though, has indicated that in the real world, an aggregate supply curve is more curved than the right angle that we used in this chapter. Rather, the real-world AS curve is very flat at levels of output far below potential (“the Keynesian zone”), very steep at levels of output above potential (“the neoclassical zone”) and curved in between (“the intermediate zone”). Figure 25.7 illustrates this. The typical aggregate supply curve leads to the concept of the Phillips curve.
英語のヒント
これまで使ってきた単純化したAD/ASモデルは、ケインズの元のモデルと完全に整合する。しかし、より最近の研究は、現実世界の総供給曲線は、本章で使った直角の形よりも曲がっていると示している。実際のAS曲線は、潜在水準を大きく下回る生産水準では非常に平坦(「ケインズ派領域」)、潜在水準を上回る生産水準では非常に急(「新古典派領域」)で、その間は曲がっている(「中間領域」)。図25.7はこれを示す。典型的な総供給曲線から、フィリップス曲線の概念が導かれる。
Keynes, Neoclassical, and Intermediate Zones in the Aggregate Supply Curve総供給曲線のケインズ派領域、新古典派領域、中間領域
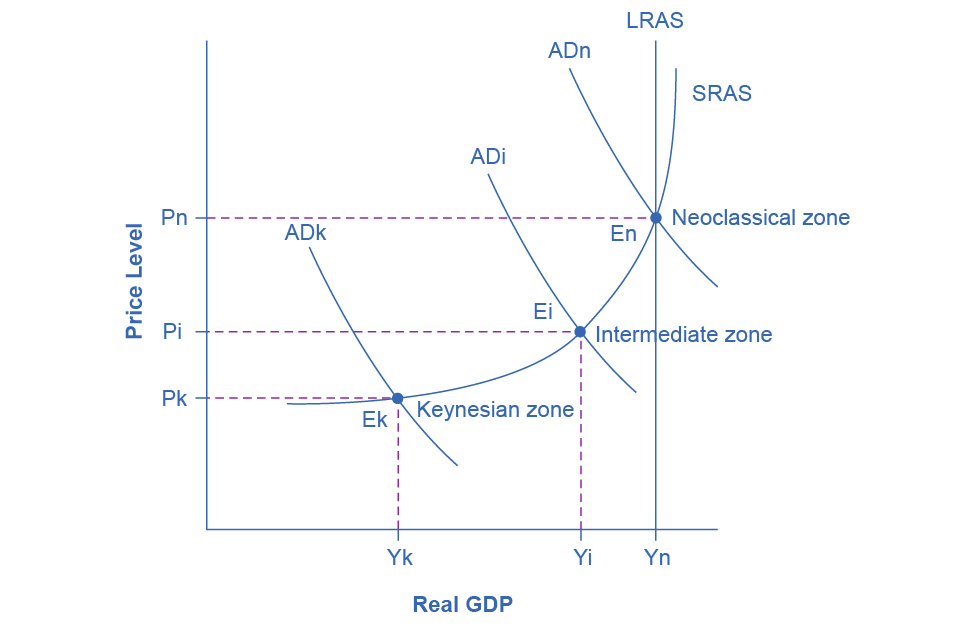
Figure 25.7図 25.7
Near the equilibrium Ek, in the Keynesian zone at the SRAS curve's far left, small shifts in AD, either to the right or the left, will affect the output level Yk, but will not much affect the price level. In the Keynesian zone, AD largely determines the quantity of output. Near the equilibrium En, in the neoclassical zone, at the SRAS curve's far right, small shifts in AD, either to the right or the left, will have relatively little effect on the output level Yn, but instead will have a greater effect on the price level. In the neoclassical zone, the near-vertical SRAS curve close to the level of potential GDP (as represented by the LRAS line) largely determines the quantity of output. In the intermediate zone around equilibrium Ei, movement in AD to the right will increase both the output level and the price level, while a movement in AD to the left would decrease both the output level and the price level.
英語のヒント
SRAS曲線の左端にあるケインズ派領域の均衡Ek付近では、ADが右または左へ少しシフトすると、生産水準Ykは変わるが、物価水準はあまり変わらない。ケインズ派領域では、主にADが生産量を決める。SRAS曲線の右端にある新古典派領域の均衡En付近では、ADが右または左へ少しシフトしても、生産水準Ynへの影響は比較的小さく、物価水準への効果の方が大きい。新古典派領域では、潜在GDP水準(LRAS線で表す)の近くにあるほぼ垂直なSRAS曲線が、主に生産量を決める。均衡Ei周辺の中間領域では、ADの右方移動は生産水準と物価水準の両方を上げ、左方移動は両方を下げる。
The Discovery of the Phillips Curveフィリップス曲線の発見
In the 1950s, A.W. Phillips, an economist at the London School of Economics, was studying the Keynesian analytical framework. The Keynesian theory implied that during a recession inflationary pressures are low, but when the level of output is at or even pushing beyond potential GDP, the economy is at greater risk for inflation. Phillips analyzed 60 years of British data and did find that tradeoff between unemployment and inflation, which became known as the Phillips curve. Figure 25.8 shows a theoretical Phillips curve, and the following Work It Out feature shows how the pattern appears for the United States.
英語のヒント
1950年代、ロンドン・スクール・オブ・エコノミクスの経済学者A・W・フィリップスは、ケインズ派の分析枠組みを研究していた。ケインズ派の理論は、景気後退中にはインフレ圧力は低いが、生産水準が潜在GDPにあるかそれを超えようとすると、経済のインフレの危険が高まることを示唆していた。フィリップスは英国の60年分のデータを分析し、失業とインフレの間のそのトレードオフを実際に見いだした。これがフィリップス曲線として知られるようになった。図25.8は理論上のフィリップス曲線を示し、続く「計算してみよう」は米国でそのパターンがどう現れるかを示す。
A Keynesian Phillips Curve Tradeoff between Unemployment and Inflationケインズ派のフィリップス曲線――失業とインフレのトレードオフ
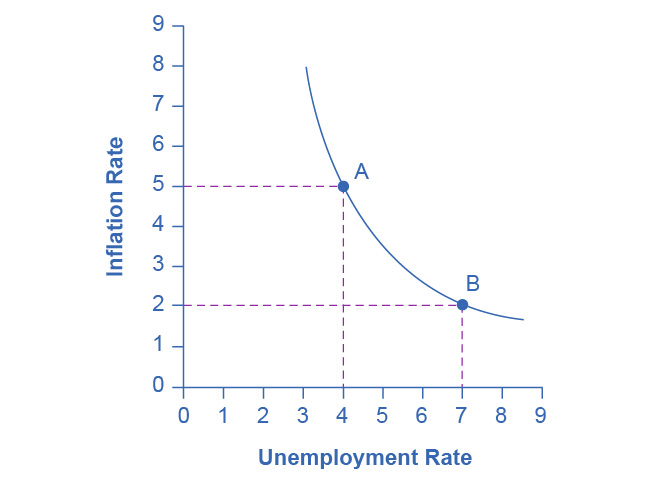


Figure 25.8図 25.8
A Phillips curve illustrates a tradeoff between the unemployment rate and the inflation rate. If one is higher, the other must be lower. For example, point A illustrates a 5% inflation rate and a 4% unemployment. If the government attempts to reduce inflation to 2%, then it will experience a rise in unemployment to 7%, as point B shows.
英語のヒント
フィリップス曲線は、失業率とインフレ率のトレードオフを示す。一方が高ければ、他方は低くなければならない。例えば点Aはインフレ率5%、失業率4%を示す。政府がインフレ率を2%に下げようとすると、点Bのように失業率は7%へ上がる。