第8章完全競争
8.2 How Perfectly Competitive Firms Make Output Decisions8.2 完全競争企業は生産量をどう決めるか
Learning Objectives学習目標
Learning Objectives学習目標
By the end of this section, you will be able to:
英語のヒント
この節を学ぶと、次のことができるようになる。
- Calculate profits by comparing total revenue and total cost
英語のヒント
総収入と総費用を比較して利潤を計算する。 - Identify profits and losses with the average cost curve
英語のヒント
平均費用曲線で利潤と損失を判別する。 - Explain the shutdown point
英語のヒント
操業停止点を説明する。 - Determine the price at which a firm should continue producing in the short run
英語のヒント
短期に生産を続けるべき価格を求める。
A perfectly competitive firm has only one major decision to make—namely, what quantity to produce. To understand this, consider a different way of writing out the basic definition of profit:
英語のヒント
完全競争企業が行う主要な決定は、生産量という一つだけである。理解するために、利潤の基本的定義を別の書き方で示そう。
Since a perfectly competitive firm must accept the price for its output as determined by the product’s market demand and supply, it cannot choose the price it charges. This is already determined in the profit equation, and so the perfectly competitive firm can sell any number of units at exactly the same price. It implies that the firm faces a perfectly elastic demand curve for its product: buyers are willing to buy any number of units of output from the firm at the market price. When the perfectly competitive firm chooses what quantity to produce, then this quantity—along with the prices prevailing in the market for output and inputs—will determine the firm’s total revenue, total costs, and ultimately, level of profits.
英語のヒント
完全競争企業は、製品市場の需要と供給で決まる価格を受け入れなければならないので、課す価格を選べない。価格は利潤の式ですでに決まっているため、まったく同じ価格でいくらでも売れる。これは製品について完全に弾力的な需要曲線に直面することを意味する。買い手は市場価格で、その企業の生産物をいくらでも買おうとする。企業が生産量を選ぶと、その数量と、生産物・投入物の市場で成立する価格が、総収入、総費用、最終的な利潤水準を決める。
Determining the Highest Profit by Comparing Total Revenue and Total Cost総収入と総費用の比較による最大利潤の決定
A perfectly competitive firm can sell as large a quantity as it wishes, as long as it accepts the prevailing market price. The formula above shows that total revenue depends on the quantity sold and the price charged. If the firm sells a higher quantity of output, then total revenue will increase. If the market price of the product increases, then total revenue also increases whatever the quantity of output sold. As an example of how a perfectly competitive firm decides what quantity to produce, consider the case of a small farmer who produces raspberries and sells them frozen for $4 per pack. Sales of one pack of raspberries will bring in $4, two packs will be $8, three packs will be $12, and so on. If, for example, the price of frozen raspberries doubles to $8 per pack, then sales of one pack of raspberries will be $8, two packs will be $16, three packs will be $24, and so on.
英語のヒント
完全競争企業は、市場価格を受け入れる限り、望むだけ多く売れる。上の式は総収入が販売量と価格に依存することを示す。販売量が増えれば総収入も増える。市場価格が上がれば、販売量がいくらでも総収入は増える。生産量の決め方の例として、ラズベリーを栽培し、冷凍して1パック4ドルで売る小規模農家を考えよう。1パックなら4ドル、2パックなら8ドル、3パックなら12ドルと収入が増える。価格が2倍の8ドルなら、1パック8ドル、2パック16ドル、3パック24ドルとなる。
Table 8.1 shows total revenue and total costs for the raspberry farm; these data also appear in Figure 8.2. The horizontal axis shows the quantity of frozen raspberries produced in packs. The vertical axis shows both total revenue and total costs, measured in dollars. The total cost curve intersects with the vertical axis at a value that shows the level of fixed costs, and then slopes upward. All these cost curves follow the same characteristics as the curves that we covered in the Production, Costs and Industry Structure chapter.
英語のヒント
表8.1はラズベリー農場の総収入と総費用を示し、同じデータが図8.2にもある。横軸は冷凍ラズベリーの生産パック数、縦軸はドルで測った総収入と総費用である。総費用曲線は固定費用の水準を示す値で縦軸と交わり、その後右上がりになる。これらの費用曲線はすべて、「生産・費用・産業構造」の章で扱った曲線と同じ特徴に従う。
Total Cost and Total Revenue at the Raspberry Farmラズベリー農場の総費用と総収入
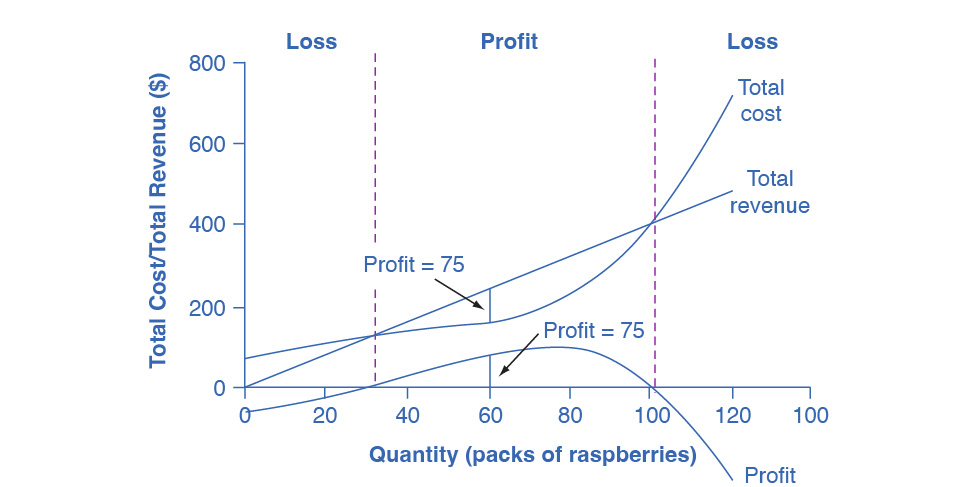

Figure 8.2図 8.2
Total revenue for a perfectly competitive firm is a straight line sloping up. The slope is equal to the price of the good. Total cost also slopes up, but with some curvature. At higher levels of output, total cost begins to slope upward more steeply because of diminishing marginal returns. The maximum profit will occur at the quantity where the difference between total revenue and total cost is largest.
英語のヒント
完全競争企業の総収入は右上がりの直線で、その傾きは財の価格と等しい。総費用も右上がりだが、湾曲している。生産量が高くなると、限界収穫逓減のため総費用はより急に上昇し始める。総収入と総費用の差が最大になる数量で、最大利潤が生じる。
Quantity (Q) 数量(Q) |
Total Cost (TC) 総費用(TC) |
Total Revenue (TR) 総収入(TR) |
Profit 利潤 |
|---|---|---|---|
0 |
$62 |
$0 |
−$62 |
10 |
$90 |
$40 |
−$50 |
20 |
$110 |
$80 |
−$30 |
30 |
$126 |
$120 |
−$6 |
40 |
$138 |
$160 |
$22 |
50 |
$150 |
$200 |
$50 |
60 |
$165 |
$240 |
$75 |
70 |
$190 |
$280 |
$90 |
80 |
$230 |
$320 |
$90 |
90 |
$296 |
$360 |
$64 |
100 |
$400 |
$400 |
$0 |
110 |
$550 |
$440 |
$−110 |
120 |
$715 |
$480 |
$−235 |
Based on its total revenue and total cost curves, a perfectly competitive firm like the raspberry farm can calculate the quantity of output that will provide the highest level of profit. At any given quantity, total revenue minus total cost will equal profit. One way to determine the most profitable quantity to produce is to see at what quantity total revenue exceeds total cost by the largest amount. Figure 8.2 shows total revenue, total cost and profit using the data from Table 8.1. The vertical gap between total revenue and total cost is profit, for example, at Q = 60, TR = 240 and TC = 165. The difference is 75, which is the height of the profit curve at that output level. The firm doesn’t make a profit at every level of output. In this example, total costs will exceed total revenues at output levels from 0 to approximately 30, and so over this range of output, the firm will be making losses. At output levels from 40 to 100, total revenues exceed total costs, so the firm is earning profits. However, at any output greater than 100, total costs again exceed total revenues and the firm is making increasing losses. Total profits appear in the final column of Table 8.1. Maximum profit occurs at an output between 70 and 80, when profit equals $90.
英語のヒント
ラズベリー農場のような完全競争企業は、総収入曲線と総費用曲線から、最高の利潤をもたらす生産量を計算できる。どの数量でも、総収入から総費用を引いたものが利潤である。最も儲かる生産量を求める一つの方法は、総収入が総費用を最大の額で上回る数量を見ることだ。図8.2は表8.1のデータを使って、総収入、総費用、利潤を示す。両曲線の縦の隔たりが利潤である。たとえばQ=60ではTR=240、TC=165で、差の75がその生産量での利潤曲線の高さである。すべての生産量で利潤が出るわけではない。この例では0から約30まで総費用が総収入を上回り、損失となる。40〜100では総収入が総費用を上回り、利潤を得る。しかし100を超えると再び総費用が上回り、損失が増える。総利潤は表8.1の最終列にある。最大利潤は生産量70〜80の間で生じ、90ドルとなる。
A higher price would mean that total revenue would be higher for every quantity sold. A lower price would mean that total revenue would be lower for every quantity sold. What happens if the price drops low enough so that the total revenue line is completely below the total cost curve; that is, at every level of output, total costs are higher than total revenues? In this instance, the best the firm can do is to suffer losses. However, a profit-maximizing firm will prefer the quantity of output where total revenues come closest to total costs and thus where the losses are smallest.
英語のヒント
価格が高ければ、どの販売量でも総収入は高くなる。低ければ、どの販売量でも総収入は低くなる。価格が十分低下し、総収入線が総費用曲線の完全に下、すなわちすべての生産量で総費用が総収入より高くなったらどうなるか。この場合、企業は最善を尽くしても損失を被る。しかし利潤最大化企業は、総収入が総費用に最も近く、したがって損失が最も小さい生産量を選ぶ。
(Later we will see that sometimes it will make sense for the firm to close, rather than stay in operation producing output.)
英語のヒント
(後で見るように、生産を続けるより操業を停止するほうが合理的な場合もある。)