第8章完全競争
Short-Run Outcomes for Perfectly Competitive Firms完全競争企業の短期の結果
The average cost and average variable cost curves divide the marginal cost curve into three segments, as Figure 8.7 shows. At the market price, which the perfectly competitive firm accepts as given, the profit-maximizing firm chooses the output level where price or marginal revenue, which are the same thing for a perfectly competitive firm, is equal to marginal cost: P = MR = MC.
英語のヒント
図8.7のように、平均費用曲線と平均可変費用曲線は限界費用曲線を三つの部分に分ける。所与として受け入れる市場価格のもとで、利潤最大化企業は、価格、すなわち完全競争企業では同じものである限界収入が、限界費用と等しくなる生産量を選ぶ。P=MR=MCである。
Profit, Loss, Shutdown利潤、損失、操業停止
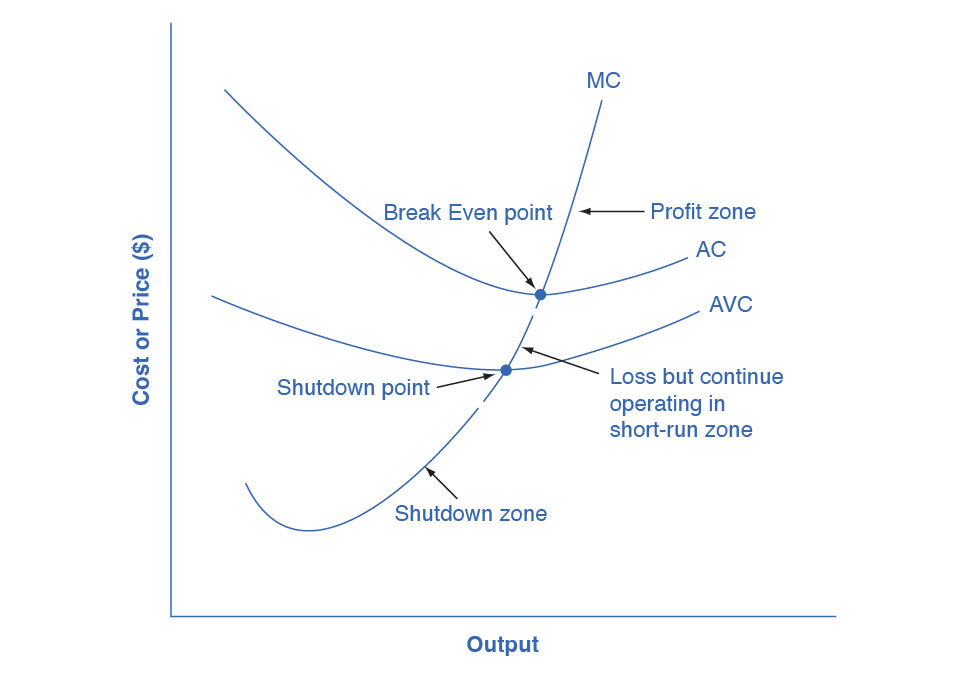

Figure 8.7図 8.7
We can divide the marginal cost curve into three zones, based on where it is crossed by the average cost and average variable cost curves. We call the point where MC crosses AC the break even point. If the firm is operating where the market price is at a level higher than the break even point, then price will be greater than average cost and the firm is earning profits. If the price is exactly at the break even point, then the firm is making zero profits. If price falls in the zone between the shutdown point and the break even point, then the firm is making losses but will continue to operate in the short run, since it is covering its variable costs, and more if price is above the shutdown-point price. However, if price falls below the price at the shutdown point, then the firm will shut down immediately, since it is not even covering its variable costs.
英語のヒント
平均費用曲線と平均可変費用曲線が交わる位置に基づき、限界費用曲線を三つの領域に分けられる。MCがACと交わる点を損益分岐点と呼ぶ。市場価格がその水準より高ければ、価格は平均費用を上回り、企業は利潤を得る。ちょうど等しければ利潤はゼロである。価格が操業停止点と損益分岐点の間なら赤字だが、変動費用を賄い、操業停止点の価格より上ならそれ以上も賄うため、短期には操業を続ける。しかし操業停止点の価格より下がると、変動費用さえ賄えないため直ちに停止する。
First consider the upper zone, where prices are above the level where marginal cost (MC) crosses average cost (AC) at the zero profit point. At any price above that level, the firm will earn profits in the short run. If the price falls exactly on the break even point where the MC and AC curves cross, then the firm earns zero profits. If a price falls into the zone between the break even point, where MC crosses AC, and the shutdown point, where MC crosses AVC, the firm will be making losses in the short run—but since the firm is more than covering its variable costs, the losses are smaller than if the firm shut down immediately. Finally, consider a price at or below the shutdown point where MC crosses AVC. At any price like this one, the firm will shut down immediately, because it cannot even cover its variable costs.
英語のヒント
まず、MCとACが交わるゼロ利潤点より価格が高い上部領域を考える。その水準より上なら、どの価格でも短期の利潤を得る。ちょうどMCとACの交点である損益分岐点なら、利潤はゼロである。価格が損益分岐点と、MCとAVCが交わる操業停止点の間にあれば、短期には赤字だが、変動費用以上を賄えるので即座に停止するより損失は小さい。最後に、操業停止点以下の価格を考える。このような価格では変動費用さえ賄えないため、直ちに停止する。
Marginal Cost and the Firm’s Supply Curve限界費用と企業の供給曲線
For a perfectly competitive firm, the marginal cost curve is identical to the firm’s supply curve starting from the minimum point on the average variable cost curve. To understand why this perhaps surprising insight holds true, first think about what the supply curve means. A firm checks the market price and then looks at its supply curve to decide what quantity to produce. Now, think about what it means to say that a firm will maximize its profits by producing at the quantity where P = MC. This rule means that the firm checks the market price, and then looks at its marginal cost to determine the quantity to produce—and makes sure that the price is greater than the minimum average variable cost. In other words, the marginal cost curve above the minimum point on the average variable cost curve becomes the firm’s supply curve.
英語のヒント
完全競争企業では、平均可変費用曲線の最小点から始まる限界費用曲線が、企業の供給曲線と一致する。この一見意外な考えを理解するため、供給曲線の意味を考えよう。企業は市場価格を確認し、供給曲線を見て生産量を決める。次に、P=MCで生産すると利潤を最大化するという意味を考えよう。企業は市場価格を確認し、限界費用を見て数量を決め、価格が平均可変費用の最小値より高いことも確認する。つまり、平均可変費用の最小点より上の限界費用曲線が、供給曲線になる。
Additional Resources追加教材
As we discussed in the chapter on Demand and Supply, many of the reasons that supply curves shift relate to underlying changes in costs. For example, a lower price of key inputs or new technologies that reduce production costs cause supply to shift to the right. In contrast, bad weather or added government regulations can add to costs of certain goods in a way that causes supply to shift to the left. We can also interpret these shifts in the firm’s supply curve as shifts of the marginal cost curve. A shift in costs of production that increases marginal costs at all levels of output—and shifts MC upward and to the left—will cause a perfectly competitive firm to produce less at any given market price. Conversely, a shift in costs of production that decreases marginal costs at all levels of output will shift MC downward and to the right and as a result, a competitive firm will choose to expand its level of output at any given price. The following Work It Out feature will walk you through an example.
英語のヒント
「需要と供給」の章で論じたように、供給曲線が移動する理由の多くは、基礎にある費用の変化に関係する。重要な投入物の値下がりや費用を減らす新技術は、供給を右へ移す。逆に悪天候や政府規制の追加は費用を高め、供給を左へ移すことがある。企業の供給曲線のこうした移動は、限界費用曲線の移動とも解釈できる。すべての生産量で限界費用を高める変化はMCを左上へ移し、どの市場価格でも生産量を減らす。逆にすべての生産量で限界費用を減らす変化はMCを右下へ移し、どの価格でも生産量を増やす選択につながる。次の「計算してみよう」で例をたどる。
Step 1. Determine the cost structure for the firm. For a given total fixed costs and variable costs, calculate total cost, average variable cost, average total cost, and marginal cost. Follow the formulas given in the Production, Costs, and Industry Structure chapter. These calculations are in Table 8.8.
英語のヒント
手順1。企業の費用構造を求める。与えられた総固定費用と変動費用から、総費用、平均可変費用、平均総費用、限界費用を計算する。「生産・費用・産業構造」の章の式に従おう。計算結果は表8.8にある。
Q |
P |
TFC |
TVC |
TC (TFC+TVC) TC(TFC+TVC) |
AVC (TVC/Q) AVC(TVC/Q) |
ATC (TC/Q) ATC(TC/Q) |
MC (TC2−TC1)/ (Q2−Q1) MC(TC2−TC1)/(Q2−Q1) |
|---|---|---|---|---|---|---|---|
0 |
$28 |
$20 |
$0 |
$20+$0=$20 |
- |
- |
- |
1 |
$28 |
$20 |
$20 |
$20+$20=$40 |
$20/1=$20.00 |
$40/1=$40.00 |
($40−$20)/ (1−0)= $20 |
2 |
$28 |
$20 |
$25 |
$20+$25=$45 |
$25/2=$12.50 |
$45/2=$22.50 |
($45−$40)/ (2−1)= $5 |
3 |
$28 |
$20 |
$35 |
$20+$35=$55 |
$35/3=$11.67 |
$55/3=$18.33 |
($55−$45)/ (3−2)= $10 |
4 |
$28 |
$20 |
$52 |
$20+$52=$72 |
$52/4=$13.00 |
$72/4=$18.00 |
($72−$55)/ (4−3)= $17 |
5 |
$28 |
$20 |
$80 |
$20+$80=$100 |
$80/5=$16.00 |
$100/5=$20.00 |
($100−$72)/ (5−4)= $28 |
Step 2. Determine the market price that the firm receives for its product. Since the firm in perfect competition is a price taker, the market price is constant. With the given price, calculate total revenue as equal to price multiplied by quantity for all output levels produced. In this example, the given price is $28. You can see that in the second column of Table 8.9.
英語のヒント
手順2。製品の受取市場価格を求める。完全競争企業は価格受容者なので、市場価格は一定である。与えられた価格を使い、各生産量について価格×数量として総収入を計算する。この例の価格は28ドルで、表8.9の第2列にある。
Quantity 数量 |
Price 価格 |
Total Revenue (P × Q) 総収入(P×Q) |
|---|---|---|
0 |
$28 |
$28×0=$0 |
1 |
$28 |
$28×1=$28 |
2 |
$28 |
$28×2=$56 |
3 |
$28 |
$28×3=$84 |
4 |
$28 |
$28×4=$112 |
5 |
$28 |
$28×5=$140 |
Step 3. Calculate profits as total cost subtracted from total revenue, as Table 8.10 shows.
英語のヒント
手順3。表8.10のように、総収入から総費用を引いて利潤を計算する。
Quantity 数量 |
Total Revenue 総収入 |
Total Cost 総費用 |
Profits (TR−TC) 利潤(TR−TC) |
|---|---|---|---|
0 |
$0 |
$20 |
$0−$20=−$20 |
1 |
$28 |
$40 |
$28−$40=−$12 |
2 |
$56 |
$45 |
$56−$45=$11 |
3 |
$84 |
$55 |
$84−$55=$29 |
4 |
$112 |
$72 |
$112−$72=$40 |
5 |
$140 |
$100 |
$140−$100=$40 |
Step 4. To find the profit-maximizing output level, look at the Marginal Cost column (at every output level produced), as Table 8.11 shows, and determine where it is equal to the market price. The output level where price equals the marginal cost is the output level that maximizes profits.
英語のヒント
手順4。利潤最大化の生産量を求めるには、表8.11の限界費用列をすべての生産量について調べ、市場価格と等しいところを見つける。価格と限界費用が等しい生産量が、利潤を最大化する。
Q |
P |
TFC |
TVC |
TC |
AVC |
ATC |
MC |
TR |
Profits 利潤 |
|---|---|---|---|---|---|---|---|---|---|
0 |
$28 |
$20 |
$0 |
$20 |
- |
- |
- |
$0 |
−$20 |
1 |
$28 |
$20 |
$20 |
$40 |
$20.00 |
$40.00 |
$20 |
$28 |
−$12 |
2 |
$28 |
$20 |
$25 |
$45 |
$12.50 |
$22.50 |
$5 |
$56 |
$11 |
3 |
$28 |
$20 |
$35 |
$55 |
$11.67 |
$18.33 |
$10 |
$84 |
$29 |
4 |
$28 |
$20 |
$52 |
$72 |
$13.00 |
$18.00 |
$17 |
$112 |
$40 |
5 |
$28 |
$20 |
$80 |
$100 |
$16.00 |
$20.00 |
$28 |
$140 |
$40 |
Step 5. Once you have determined the profit-maximizing output level (in this case, output quantity 5), you can look at the amount of profits made (in this case, $40).
英語のヒント
手順5。利潤最大化生産量、この場合は5を求めたら、利潤額、この場合は40ドルを確認できる。
Step 6. If the firm is making economic losses, the firm needs to determine whether it produces the output level where price equals marginal revenue and equals marginal cost or it shuts down and only incurs its fixed costs.
英語のヒント
手順6。経済的損失が出ているなら、価格=限界収入=限界費用となる量を生産するか、操業を止め固定費用だけを負うかを決める必要がある。
Step 7. For the output level where marginal revenue is equal to marginal cost, check if the market price is greater than the average variable cost of producing that output level.
英語のヒント
手順7。限界収入が限界費用と等しい生産量について、市場価格がその量を作る平均可変費用より高いか確認する。
- If P > AVC but P < ATC, then the firm continues to produce in the short-run, making economic losses.
英語のヒント
P>AVCだがP<ATCなら、企業は経済的損失を出しながら短期の生産を続ける。 - If P < AVC, then the firm stops producing and only incurs its fixed costs.
英語のヒント
P<AVCなら、生産を止め固定費用だけを負う。
In this example, the price of $28 is greater than the AVC ($16.40) of producing 5 units of output, so the firm continues producing.
英語のヒント
この例では、価格28ドルが5単位生産時のAVC(16.40ドル)を上回るため、生産を続ける。