第8章完全競争
Profits and Losses with the Average Cost Curve平均費用曲線と利潤・損失
Does maximizing profit (producing where MR = MC) imply an actual economic profit? The answer depends on the relationship between price and average total cost, which is the average profit or profit margin. If the market price is higher than the firm's average cost of production for that quantity produced, then the profit margin is positive and the firm will earn profits. Conversely, if the market price is lower than the average cost of production, the profit margin is negative and the firm will suffer losses. You might think that, in this situation, the firm may want to shut down immediately. Remember, however, that the firm has already paid for fixed costs, such as equipment, so it may continue to produce for a while and incur a loss. Table 8.3 continues the raspberry farm example. Figure 8.5 illustrates the three possible scenarios: (a) where price intersects marginal cost at a level above the average cost curve, (b) where price intersects marginal cost at a level equal to the average cost curve, and (c) where price intersects marginal cost at a level below the average cost curve.
英語のヒント
利潤を最大化する、つまりMR=MCで生産することは、実際の経済的利潤を意味するのか。答えは価格と平均総費用の関係、すなわち平均利潤や利幅による。その生産量で市場価格が平均生産費用より高ければ利幅は正で、利潤を得る。逆に価格が平均費用より低ければ利幅は負で、損失を被る。その場合すぐ操業停止したいと思うかもしれない。しかし設備などの固定費用はすでに支払っているため、しばらく損失を出しながら生産を続けることもある。表8.3はラズベリー農場の例の続きである。図8.5は、(a)価格が平均費用曲線より上で限界費用と交わる、(b)平均費用と等しい水準で交わる、(c)平均費用曲線より下で交わる、という三つの可能性を示す。
Price and Average Cost at the Raspberry Farmラズベリー農場の価格と平均費用
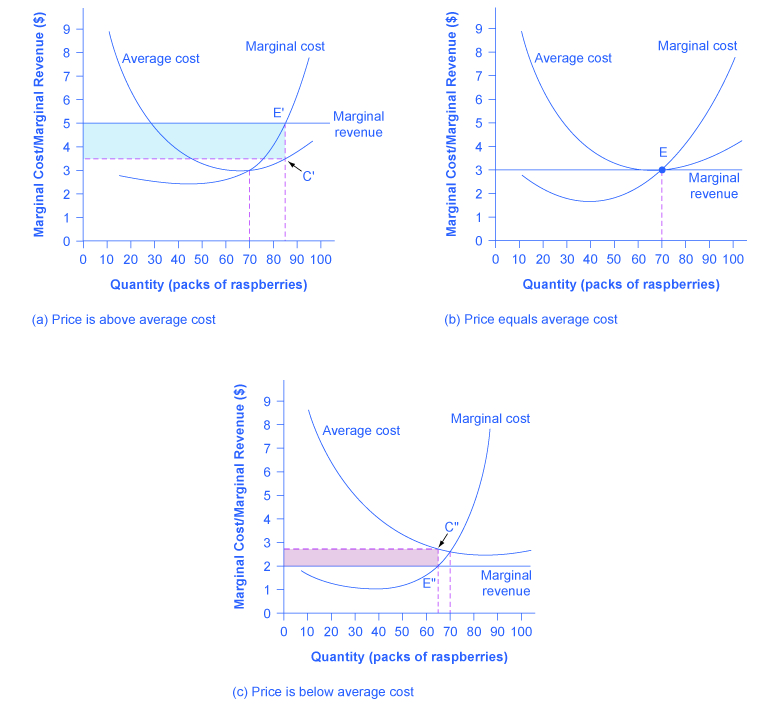

Figure 8.5図 8.5
In (a), price intersects marginal cost above the average cost curve. Since price is greater than average cost, the firm is making a profit. In (b), price intersects marginal cost at the minimum point of the average cost curve. Since price is equal to average cost, the firm is breaking even. In (c), price intersects marginal cost below the average cost curve. Since price is less than average cost, the firm is making a loss.
英語のヒント
(a)では価格は平均費用曲線より上で限界費用と交わる。価格が平均費用を超えるため利潤を得る。(b)では平均費用曲線の最小点で交わる。価格と平均費用が等しいため収支が均衡する。(c)では平均費用曲線より下で交わる。価格が平均費用を下回るため損失を被る。
First consider a situation where the price is equal to $5 for a pack of frozen raspberries. The rule for a profit-maximizing perfectly competitive firm is to produce the level of output where Price= MR = MC, so the raspberry farmer will produce a quantity of approximately 85, which is labeled as E' in Figure 8.5 (a). Remember that the area of a rectangle is equal to its base multiplied by its height. The farm’s total revenue at this price will be shown by the rectangle from the origin over to a quantity of 85 packs (the base) up to point E' (the height), over to the price of $5, and back to the origin. The average cost of producing 85 packs is shown by point C or about $3.09. Total costs will be the quantity of 85 times the average cost of $3.09, which is shown by the area of the rectangle from the origin to a quantity of 85, up to point C, over to the vertical axis and down to the origin. The difference between total revenues and total costs is profits. Thus, profits will be the blue shaded rectangle on top.
英語のヒント
まず冷凍ラズベリー1パックの価格が5ドルの場合を考える。利潤最大化の規則は価格=MR=MCの生産量なので、図8.5(a)のE'で示す約85パックを生産する。長方形の面積は底辺×高さであることを思い出そう。この価格での総収入は、原点から85パック(底辺)へ、上のE'(高さ)へ、価格5ドルへ、そして原点へ戻る長方形で示される。85パックの平均費用はC、約3.09ドルである。総費用は85×3.09ドルで、原点から数量85へ、上のCへ、縦軸へ、そして原点へ下がる長方形の面積で示される。総収入と総費用の差が利潤なので、上側の青い長方形が利潤となる。
We calculate this as:
英語のヒント
次のように計算する。
Or, we can calculate it as:
英語のヒント
または、次のように計算できる。
Now consider Figure 8.5 (b), where the price has fallen to $2.80 for a pack of frozen raspberries. Again, the perfectly competitive firm will choose the level of output where Price = MR = MC, but in this case, the quantity produced will be 75. At this price and output level, where the marginal cost curve is crossing the average cost curve, the price the firm receives is exactly equal to its average cost of production. We call this the break even point.
英語のヒント
次に、冷凍ラズベリー1パックの価格が2.80ドルへ下がった図8.5(b)を考える。やはり価格=MR=MCを選ぶが、この場合の生産量は75となる。限界費用曲線が平均費用曲線と交わるこの価格と数量では、受取価格は平均生産費用と正確に等しい。これを損益分岐点と呼ぶ。
The farm’s total revenue at this price can be shown by the rectangle from the origin over to a quantity of 75 packs (the base) up to point E (the height), over to the price of $2.80, and back to the origin. The height of the average cost curve at Q = 75, i.e. point E, shows the average cost of producing this quantity. Total costs will be the quantity of 75 times the average cost of $2.80, which is shown by the area of the rectangle from the origin to a quantity of 75, up to point E, over to the vertical axis and down to the origin. It should be clear that the rectangles for total revenue and total cost are the same. (This is also why these two rectangles are not shaded in Figure 8.5 (b).) Thus, the firm is making zero profit. The calculations are as follows:
英語のヒント
この価格での総収入は、原点から75パック(底辺)へ、上のE(高さ)へ、価格2.80ドルへ、そして原点へ戻る長方形で示せる。Q=75での平均費用曲線の高さ、すなわちEは、この数量の平均費用を示す。総費用は75×2.80ドルで、原点から数量75へ、上のEへ、縦軸へ、そして原点へ下がる長方形の面積となる。総収入と総費用の長方形は同じである。(図8.5(b)で両方に色を付けていないのもそのためだ。)したがって利潤はゼロで、計算は次のとおりである。
Or, we can calculate it as:
英語のヒント
または、次のように計算できる。
In Figure 8.5 (c), the market price has fallen still further to $2.00 for a pack of frozen raspberries. At this price, marginal revenue intersects marginal cost at a quantity of 65. The farm’s total revenue at this price will be shown by the large shaded rectangle from the origin over to a quantity of 65 packs (the base) up to point E” (the height), over to the price of $2, and back to the origin. The average cost of producing 65 packs is shown by Point C” or shows the average cost of producing 50 packs is about $2.73. Total costs will be the quantity of 65 times the average cost of $2.73, which the area of the rectangle from the origin to a quantity of 50, up to point C”, over to the vertical axis and down to the origin shows. It should be clear from examining the two rectangles that total revenue is less than total cost. Thus, the firm is losing money and the loss (or negative profit) will be the rose-shaded rectangle.
英語のヒント
図8.5(c)では価格がさらに下がり、1パック2.00ドルになる。限界収入は数量65で限界費用と交わる。総収入は、原点から65パック(底辺)へ、上のE”(高さ)へ、価格2ドルへ、そして原点へ戻る大きな色付き長方形で示される。65パックの平均費用はC”で示され、あるいは50パックの平均費用が約2.73ドルと示される。総費用は65×2.73ドルで、原点から数量50へ、上のC”へ、縦軸へ、そして原点へ下がる長方形の面積で示される。二つの長方形を見ると、総収入が総費用より小さいことは明らかである。企業は損失を出し、その損失、すなわち負の利潤は薄紅色の長方形となる。
The calculations are:
英語のヒント
計算は次のとおりである。
Or:
英語のヒント
または、次のようになる。
If the market price that perfectly competitive firm receives leads it to produce at a quantity where the price is greater than average cost, the firm will earn profits. If the price the firm receives causes it to produce at a quantity where price equals average cost, which occurs at the minimum point of the AC curve, then the firm earns zero profits. Finally, if the price the firm receives leads it to produce at a quantity where the price is less than average cost, the firm will earn losses. Table 8.4 summarizes this.
英語のヒント
受け取る市場価格によって、価格が平均費用より高い数量を生産するなら、完全競争企業は利潤を得る。価格と平均費用が等しい、AC曲線の最小点の数量を生産するなら、利潤はゼロとなる。最後に、価格が平均費用より低い数量を生産するなら、損失を被る。表8.4にまとめる。
If... 条件 |
Then... 結果 |
|---|---|
Price > ATC 価格>ATC |
Firm earns an economic profit 企業は経済的利潤を得る |
Price = ATC 価格=ATC |
Firm earns zero economic profit 企業の経済的利潤はゼロ |
Price < ATC 価格<ATC |
Firm earns a loss 企業は損失を被る |