第8章完全競争
Comparing Marginal Revenue and Marginal Costs限界収入と限界費用の比較
The approach that we described in the previous section, using total revenue and total cost, is not the only approach to determining the profit maximizing level of output. In this section, we provide an alternative approach which uses marginal revenue and marginal cost.
英語のヒント
前の項で述べた、総収入と総費用を使う方法だけが、利潤最大化生産量を決める方法ではない。ここでは、限界収入と限界費用を使う別の方法を示す。
Firms often do not have the necessary data they need to draw a complete total cost curve for all levels of production. They cannot be sure of what total costs would look like if they, say, doubled production or cut production in half, because they have not tried it. Instead, firms experiment. They produce a slightly greater or lower quantity and observe how it affects profits. In economic terms, this practical approach to maximizing profits means examining how changes in production affect marginal revenue and marginal cost.
英語のヒント
企業は、すべての生産量について完全な総費用曲線を描くのに必要なデータを持っていないことが多い。生産を2倍や半分にした場合の総費用は、試したことがないので確信できない。代わりに企業は実験する。少しだけ多く、または少なく生産し、利潤への影響を観察する。経済学的にいうと、この実際的な利潤最大化の方法は、生産の変化が限界収入と限界費用にどう影響するかを調べることである。
Figure 8.3 presents the marginal revenue and marginal cost curves based on the total revenue and total cost in Table 8.1. The marginal revenue curve shows the additional revenue gained from selling one more unit. As mentioned before, a firm in perfect competition faces a perfectly elastic demand curve for its product—that is, the firm’s demand curve is a horizontal line drawn at the market price level. This also means that the firm’s marginal revenue curve is the same as the firm’s demand curve: Every time a consumer demands one more unit, the firm sells one more unit and revenue increases by exactly the same amount equal to the market price. In this example, every time the firm sells a pack of frozen raspberries, the firm’s revenue increases by $4. Table 8.2 shows an example of this. This condition only holds for price taking firms in perfect competition where:
英語のヒント
The formula for marginal revenue is:
英語のヒント
限界収入の式は次のとおりである。
Price 価格 |
Quantity 数量 |
Total Revenue 総収入 |
Marginal Revenue 限界収入 |
|---|---|---|---|
$4 |
1 |
$4 |
- |
$4 |
2 |
$8 |
$4 |
$4 |
3 |
$12 |
$4 |
$4 |
4 |
$16 |
$4 |
Notice that marginal revenue does not change as the firm produces more output. That is because under perfect competition, the price is determined through the interaction of supply and demand in the market and does not change as the farmer produces more (keeping in mind that, due to the relative small size of each firm, increasing their supply has no impact on the total market supply where price is determined).
英語のヒント
生産量を増やしても限界収入は変わらないことに注意しよう。完全競争では価格は市場の需要と供給の相互作用で決まり、農家が増産しても変わらないからだ。個々の企業が比較的小さいため、供給を増やしても、価格を決める市場全体の供給には影響しないことを忘れないようにしよう。
Since a perfectly competitive firm is a price taker, it can sell whatever quantity it wishes at the market-determined price. We calculate marginal cost, the cost per additional unit sold, by dividing the change in total cost by the change in quantity. The formula for marginal cost is:
英語のヒント
完全競争企業は価格受容者なので、市場が決める価格で望む数量を売れる。追加で販売する1単位当たりの費用である限界費用は、総費用の変化を数量の変化で割って求める。式は次のとおりである。
Ordinarily, marginal cost changes as the firm produces a greater quantity.
英語のヒント
通常、生産量が増えると限界費用は変化する。
In the raspberry farm example, in Figure 8.3 and Table 8.3, marginal cost at first declines as production increases from 10 to 20 to 30 to 40 packs of raspberries—which represents the area of increasing marginal returns that is not uncommon at low levels of production. At some point, though, marginal costs start to increase, displaying the typical pattern of diminishing marginal returns. If the firm is producing at a quantity where MR > MC, like 40 or 50 packs of raspberries, then it can increase profit by increasing output because the marginal revenue is exceeding the marginal cost. If the firm is producing at a quantity where MC > MR, like 90 or 100 packs, then it can increase profit by reducing output because the reductions in marginal cost will exceed the reductions in marginal revenue. The firm’s profit-maximizing choice of output will occur where MR = MC (or at a choice close to that point).
英語のヒント
Marginal Revenues and Marginal Costs at the Raspberry Farm: Individual Farmerラズベリー農場の限界収入と限界費用:個別農家
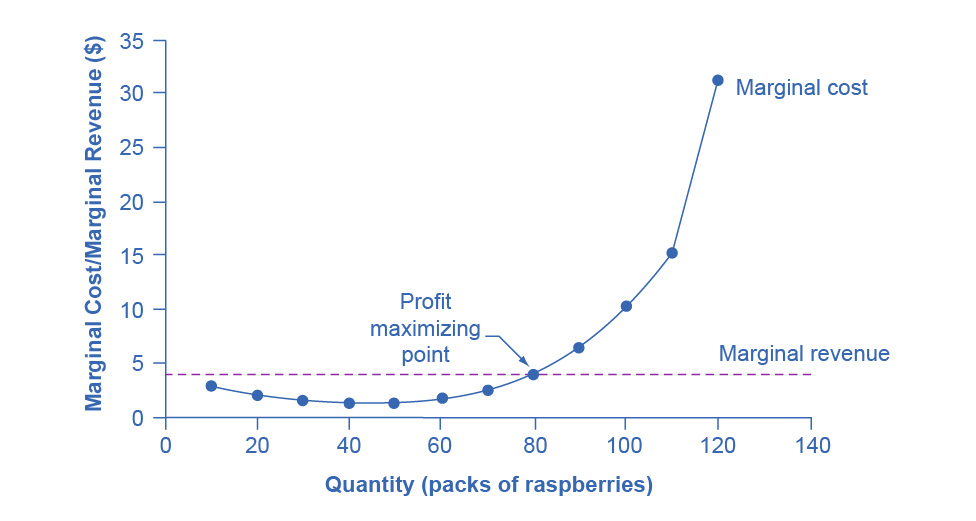
Figure 8.3図 8.3
For a perfectly competitive firm, the marginal revenue (MR) curve is a horizontal line because it is equal to the price of the good, which is determined by the market, as Figure 8.4 illustrates. The marginal cost (MC) curve is sometimes initially downward-sloping, if there is a region of increasing marginal returns at low levels of output, but is eventually upward-sloping at higher levels of output as diminishing marginal returns kick in.
英語のヒント
図8.4のように、完全競争企業の限界収入(MR)曲線は、市場で決まる財の価格と等しいため水平線となる。低生産量で限界収穫逓増の範囲があれば、限界費用(MC)曲線は当初右下がりになることもあるが、生産量が高くなると限界収穫逓減が働き、最終的に右上がりになる。
Supply, Demand, and Equilibrium Price in the Market for Raspberriesラズベリー市場の供給、需要、均衡価格
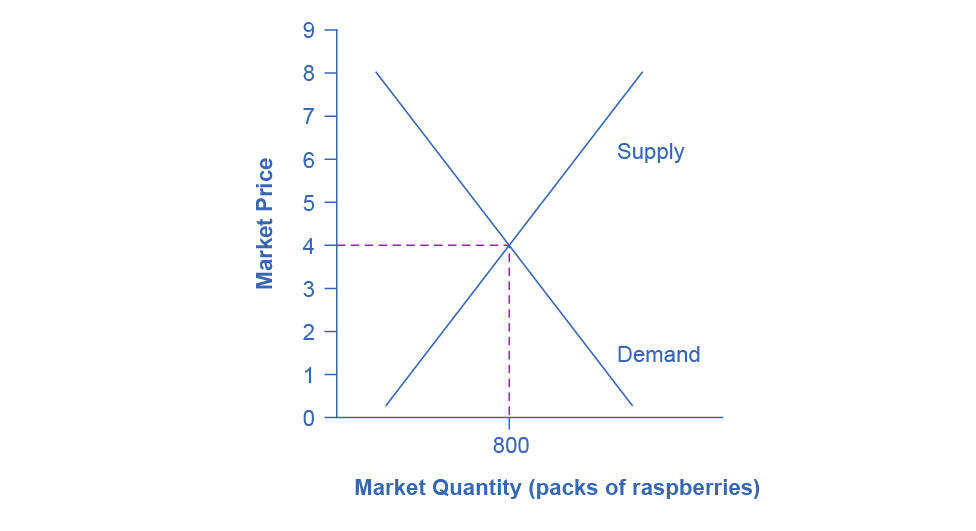


Figure 8.4図 8.4
The equilibrium price of raspberries is determined through the interaction of market supply and market demand at $4.00. If there are 10 farms in the market, the equilibrium quantity is 80 × 10 = 800.
英語のヒント
ラズベリーの均衡価格は、市場供給と市場需要の相互作用によって4.00ドルに決まる。農場が10軒あれば、均衡数量は80×10=800である。
Quantity 数量 |
Total Cost 総費用 |
Marginal Cost 限界費用 |
Total Revenue 総収入 |
Marginal Revenue 限界収入 |
Profit 利潤 |
|---|---|---|---|---|---|
0 |
$62 |
- |
$0 |
$4 |
-$62 |
10 |
$90 |
$2.80 |
$40 |
$4 |
-$50 |
20 |
$110 |
$2.00 |
$80 |
$4 |
-$30 |
30 |
$126 |
$1.60 |
$120 |
$4 |
-$6 |
40 |
$138 |
$1.20 |
$160 |
$4 |
$22 |
50 |
$150 |
$1.20 |
$200 |
$4 |
$50 |
60 |
$165 |
$1.50 |
$240 |
$4 |
$75 |
70 |
$190 |
$2.50 |
$280 |
$4 |
$90 |
80 |
$230 |
$4.00 |
$320 |
$4 |
$90 |
90 |
$296 |
$6.60 |
$360 |
$4 |
$64 |
100 |
$400 |
$10.40 |
$400 |
$4 |
$0 |
110 |
$550 |
$15.00 |
$440 |
$4 |
-$110 |
120 |
$715 |
$16.50 |
$480 |
$4 |
-$235 |
In this example, the marginal revenue and marginal cost curves cross at a price of $4 and a quantity of 80 produced. If the farmer started out producing at a level of 60, and then experimented with increasing production to 70, marginal revenues from the increase in production would exceed marginal costs—and so profits would rise. The farmer has an incentive to keep producing. At a level of output of 80, marginal cost and marginal revenue are equal so profit doesn’t change. If the farmer then experimented further with increasing production from 80 to 90, he would find that marginal costs from the increase in production are greater than marginal revenues, and so profits would decline.
英語のヒント
この例では、限界収入曲線と限界費用曲線は価格4ドル、生産量80で交わる。農家が最初60を生産し、70へ増やしてみると、追加生産の限界収入が限界費用を上回り、利潤は増える。生産を増やし続ける誘因がある。生産量80では限界費用と限界収入が等しいため、利潤は変わらない。さらに80から90へ増やしてみると、限界費用が限界収入を上回り、利潤が減るとわかる。
The profit-maximizing choice for a perfectly competitive firm will occur at the level of output where marginal revenue is equal to marginal cost—that is, where MR = MC. This occurs at Q = 80 in the figure.
英語のヒント
完全競争企業の利潤最大化は、限界収入と限界費用が等しい、すなわちMR=MCの生産量で起こる。図ではQ=80に当たる。
Because the marginal revenue received by a perfectly competitive firm is equal to the price P, we can also write the profit-maximizing rule for a perfectly competitive firm as a recommendation to produce at the quantity of output where P = MC.
英語のヒント
完全競争企業の限界収入は価格Pと等しいため、利潤最大化の規則は、P=MCとなる生産量を選ぶという形にも書ける。