第11章独占と反トラスト政策
11.3 Regulating Natural Monopolies11.3 自然独占の規制
Learning Objectives学習目標
Learning Objectives学習目標
By the end of this section, you will be able to:
英語のヒント
この節を学ぶと、次のことができるようになる。
- Evaluate the appropriate competition policy for a natural monopoly
英語のヒント
自然独占に適切な競争政策を評価する - Interpret a graph of regulatory choices
英語のヒント
規制の選択肢を示すグラフを解釈する - Contrast cost-plus and price cap regulation
英語のヒント
コストプラス規制と価格上限規制を対比する
Most true monopolies today in the U.S. are regulated, natural monopolies. A natural monopoly poses a difficult challenge for competition policy, because the structure of costs and demand makes competition unlikely or costly. A natural monopoly arises when average costs are declining over the range of production that satisfies market demand. This typically happens when fixed costs are large relative to variable costs. As a result, one firm is able to supply the total quantity demanded in the market at lower cost than two or more firms—so splitting up the natural monopoly would raise the average cost of production and force customers to pay more.
英語のヒント
今日の米国にある真の独占の大部分は、規制された自然独占である。自然独占は競争政策に難しい課題を突きつける。費用と需要の構造によって、競争が起こりにくいか、競争に費用がかかるためである。自然独占は、市場需要を満たす生産範囲全体で平均費用が低下するときに生じる。通常、これは固定費用が可変費用に比べて大きいときに起こる。その結果、1社が2社以上よりも低い費用で市場の総需要量を供給できる。したがって自然独占を分割すると、平均生産費用が上がり、顧客の負担が増える。
Public utilities, the companies that have traditionally provided water and electrical service across much of the United States, are leading examples of natural monopoly. It would make little sense to argue that a local water company should be divided into several competing companies, each with its own separate set of pipes and water supplies. Installing four or five identical sets of pipes under a city, one for each water company, so that each household could choose its own water provider, would be terribly costly. The same argument applies to the idea of having many competing companies for delivering electricity to homes, each with its own set of wires. Before the advent of wireless phones, the argument also applied to the idea of many different phone companies, each with its own set of phone wires running through the neighborhood.
英語のヒント
米国の広い地域で伝統的に水道や電力のサービスを提供してきた公益事業者は、自然独占の代表例である。地域の水道会社を、独自の配管と水源を持つ複数の競合会社に分割すべきだと主張しても、ほとんど意味がない。各家庭が水道会社を選べるように、都市の地下に同じ配管網を水道会社ごとに4組、5組と敷設すれば、莫大な費用がかかる。同じ議論は、独自の電線網を持つ多数の競合会社が家庭へ送電するという考えにも当てはまる。無線電話が登場する前には、独自の電話線網を近隣一帯に張る多数の電話会社という考えにも当てはまった。
The Choices in Regulating a Natural Monopoly自然独占を規制する際の選択肢
What then is the appropriate competition policy for a natural monopoly? Figure 11.3 illustrates the case of natural monopoly, with a market demand curve that cuts through the downward-sloping portion of the average cost curve. Points A, B, C, and F illustrate four of the main choices for regulation. Table 11.5 outlines the regulatory choices for dealing with a natural monopoly.
英語のヒント
Regulatory Choices in Dealing with Natural Monopoly自然独占に対処する規制の選択肢
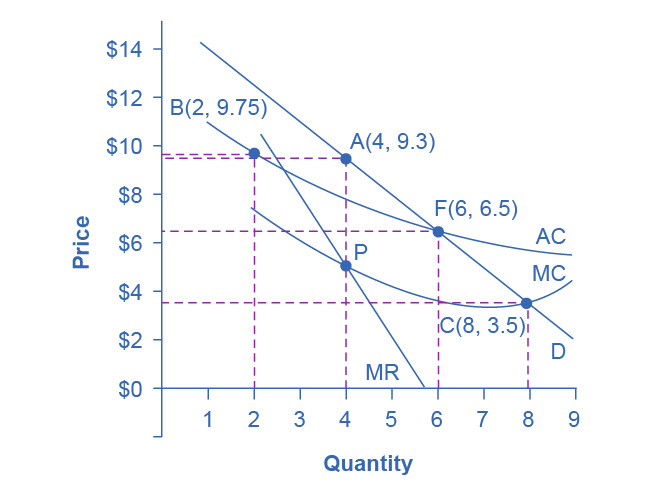

Figure 11.3図 11.3
A natural monopoly will maximize profits by producing at the quantity where marginal revenue (MR) equals marginal costs (MC) and by then looking to the market demand curve to see what price to charge for this quantity. This monopoly will produce at point A, with a quantity of 4 and a price of 9.3. If antitrust regulators split this company exactly in half, then each half would produce at point B, with average costs of 9.75 and output of 2. The regulators might require the firm to produce where marginal cost crosses the market demand curve at point C. However, if the firm is required to produce at a quantity of 8 and sell at a price of 3.5, the firm will incur losses. The most likely choice is point F, where the firm is required to produce a quantity of 6 and charge a price of 6.5.
英語のヒント
自然独占企業は、限界収入(MR)が限界費用(MC)に等しい数量を生産し、次に市場需要曲線からその数量に設定できる価格を調べることで利潤を最大化する。この独占企業は点Aで、数量4、価格9.3として生産する。反トラスト担当者がこの会社をちょうど半分に分割すれば、各社は点Bで生産し、平均費用は9.75、生産量は2となる。規制担当者は、限界費用が市場需要曲線と交わる点Cでの生産を要求するかもしれない。しかし数量8を生産し、価格3.5で販売するよう求められれば、企業は損失を被る。最もありそうな選択は点Fで、企業は数量6を生産し、価格6.5を設定するよう求められる。
Quantity 数量 |
Price 価格 |
Total Revenue* 総収入* |
Marginal Revenue 限界収入 |
Total Cost 総費用 |
Marginal Cost 限界費用 |
Average Cost 平均費用 |
|---|---|---|---|---|---|---|
1 |
14.7 |
14.7 |
14.7 |
11.0 |
- |
11.00 |
2 |
12.4 |
24.7 |
10.0 |
19.5 |
8.5 |
9.75 |
3 |
10.6 |
31.7 |
7.0 |
25.5 |
6.0 |
8.50 |
4 |
9.3 |
37.2 |
5.5 |
31.0 |
5.5 |
7.75 |
5 |
8.0 |
40.0 |
2.8 |
35.0 |
4.0 |
7.00 |
6 |
6.5 |
39.0 |
–1.0 |
39.0 |
4.0 |
6.50 |
7 |
5.0 |
35.0 |
–4.0 |
42.0 |
3.0 |
6.00 |
8 |
3.5 |
28.0 |
–7.0 |
45.5 |
3.5 |
5.70 |
9 |
2.0 |
18.0 |
–10.0 |
49.5 |
4.0 |
5.5 |
The first possibility is to leave the natural monopoly alone. In this case, the monopoly will follow its normal approach to maximizing profits. It determines the quantity where MR = MC, which happens at point P at a quantity of 4. The firm then looks to point A on the demand curve to find that it can charge a price of 9.3 for that profit-maximizing quantity. Since the price is above the average cost curve, the natural monopoly would earn economic profits.
英語のヒント
第1の可能性は、自然独占をそのままにしておくことである。この場合、独占企業は通常の利潤最大化の方法に従う。MR = MCとなる数量を決めると、点Pで数量4となる。次に需要曲線上の点Aを見て、その利潤最大化数量に価格9.3を設定できるとわかる。価格が平均費用曲線より上にあるため、自然独占企業は経済的利潤を得る。
While unlikely, a second outcome may arise if antitrust authorities decide to divide the company, so that the new firms can compete. As a simple example, imagine that the company is cut in half. Thus, instead of one large firm producing a quantity of 4, two half-size firms each produce a quantity of 2. Because of the declining average cost curve (AC), the average cost of production for each of the half-size companies producing 2, as point B shows, would be 9.75, while the average cost of production for a larger firm producing 4 would only be 7.75. Thus, the economy would become less productively efficient, since the good is produced at a higher average cost. In a situation with a downward-sloping average cost curve, two smaller firms will always have higher average costs of production than one larger firm for any quantity of total output. In addition, the antitrust authorities must worry that splitting the natural monopoly into pieces may be only the start of their problems. If one of the two firms grows larger than the other, it will have lower average costs and may be able to drive its competitor out of the market. Alternatively, two firms in a market may discover subtle ways of coordinating their behavior and keeping prices high. Either way, the result will not be the greater competition that was desired.
英語のヒント
可能性は低いが、第2の結果は、反トラスト当局が、新会社同士を競争させるため企業の分割を決める場合に起こりうる。簡単な例として、会社を半分に分けるとしよう。すると、大企業1社が数量4を生産する代わりに、半分の規模の2社がそれぞれ数量2を生産する。平均費用曲線(AC)が低下しているため、点Bが示すように、数量2を生産する半分の規模の各社の平均生産費用は9.75となるのに対し、数量4を生産する大企業の平均生産費用は7.75にすぎない。財がより高い平均費用で生産されるため、経済の生産効率は低下する。平均費用曲線が右下がりである状況では、総生産量がどれだけであっても、小さい2社の平均生産費用は、より大きい1社より常に高くなる。さらに反トラスト当局は、自然独占を分割することが問題の始まりにすぎないかもしれないと懸念しなければならない。2社の一方が他方より大きくなれば、平均費用が下がり、競争相手を市場から追い出せるかもしれない。あるいは市場の2社が、行動を調整して価格を高く維持する巧妙な方法を見つけることもある。どちらにしても、望んでいた競争の増大という結果にはならない。
A third alternative is that regulators may decide to set prices and quantities produced for this industry. The regulators will try to choose a point along the market demand curve that benefits both consumers and the broader social interest. Point C illustrates one tempting choice: the regulator requires that the firm produce the quantity of output where marginal cost crosses the demand curve at an output of 8, and charge the price of 3.5, which is equal to marginal cost at that point. This rule is appealing because it requires price to be set equal to marginal cost, which is what would occur in a perfectly competitive market, and it would assure consumers a higher quantity and lower price than at the monopoly choice A. In fact, efficient allocation of resources would occur at point C, since the value to the consumers of the last unit bought and sold in this market is equal to the marginal cost of producing it.
英語のヒント
第3の選択肢は、この産業の価格と生産量を規制担当者が決めることである。規制担当者は、市場需要曲線上で、消費者とより広い社会の利益の両方にかなう点を選ぼうとする。点Cは魅力的な選択肢の1つを示す。企業に対し、限界費用が需要曲線と交わる生産量8を生産し、その点の限界費用と等しい価格3.5を設定するよう要求するのである。この規則が魅力的なのは、完全競争市場と同じように価格を限界費用に等しくすることを求め、独占の選択Aより多い数量と低い価格を消費者に保証するためである。実際、点Cでは、この市場で最後に売買される1単位の消費者にとっての価値が、その生産の限界費用に等しくなるので、資源の効率的な配分が実現する。
Attempting to bring about point C through force of regulation, however, runs into a severe difficulty. At point C, with an output of 8, a price of 3.5 is below the average cost of production, which is 5.7, so if the firm charges a price of 3.5, it will be suffering losses. Unless the regulators or the government offer the firm an ongoing public subsidy (and there are numerous political problems with that option), the firm will lose money and go out of business.
英語のヒント
しかし規制の力で点Cを実現しようとすると、深刻な困難に直面する。生産量8の点Cでは、価格3.5は平均生産費用5.7を下回るため、その価格を設定すると企業は損失を被る。規制担当者や政府が継続的な公的補助金を企業に与えないかぎり(そして、この選択肢には多くの政治的問題がある)、企業は赤字となり廃業する。
Perhaps the most plausible option for the regulator is point F; that is, to set the price where AC crosses the demand curve at an output of 6 and a price of 6.5. This plan makes some sense at an intuitive level: let the natural monopoly charge enough to cover its average costs and earn a normal rate of profit, so that it can continue operating, but prevent the firm from raising prices and earning abnormally high monopoly profits, as it would at the monopoly choice A. Determining this level of output and price with the political pressures, time constraints, and limited information of the real world is much harder than identifying the point on a graph. For more on the problems that can arise from a centrally determined price, see the discussion of price floors and price ceilings in Demand and Supply.
英語のヒント
規制担当者にとって最も妥当と思われる選択肢は、おそらく点Fである。つまりACが需要曲線と交わる、生産量6、価格6.5の点に価格を設定する。この計画は直感的にある程度理解できる。自然独占企業が操業を続けられるように、平均費用を回収して通常の利潤率を得られるだけの価格を認める一方、独占の選択Aのように、価格を引き上げて異常に高い独占利潤を得ることは防ぐのである。現実の政治的圧力、時間的制約、限られた情報のもとでこの生産量と価格を決めることは、グラフ上の点を特定するよりはるかに難しい。中央で決められた価格から生じうる問題について詳しくは、「需要と供給」の価格下限と価格上限の議論を参照。