第10章独占的競争と寡占
How a Monopolistic Competitor Chooses Price and Quantity独占的競争企業は価格と数量をどのように選ぶか
The monopolistically competitive firm decides on its profit-maximizing quantity and price in much the same way as a monopolist. A monopolistic competitor, like a monopolist, faces a downward-sloping demand curve, and so it will choose some combination of price and quantity along its perceived demand curve.
英語のヒント
独占的競争企業は、独占企業とほぼ同じ方法で、利潤を最大にする数量と価格を決める。独占的競争企業は独占企業と同様、右下がりの需要曲線に直面するため、自社が認識する需要曲線上の価格と数量の組合せを選ぶ。
As an example of a profit-maximizing monopolistic competitor, consider the Authentic Chinese Pizza store, which serves pizza with cheese, sweet and sour sauce, and your choice of vegetables and meats. Although Authentic Chinese Pizza must compete against other pizza businesses and restaurants, it has a differentiated product. The firm’s perceived demand curve is downward sloping, as Figure 10.3 shows and the first two columns of Table 10.1.
英語のヒント
How a Monopolistic Competitor Chooses its Profit Maximizing Output and Price独占的競争企業は利潤を最大にする生産量と価格をどのように選ぶか
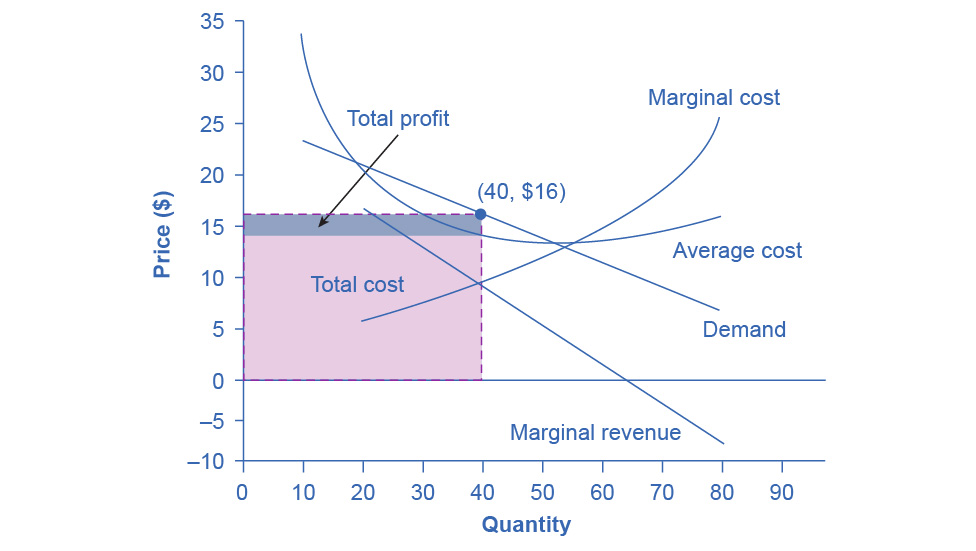

Figure 10.3図 10.3
To maximize profits, the Authentic Chinese Pizza shop would choose a quantity where marginal revenue equals marginal cost, or Q where MR = MC. Here it would choose a quantity of 40 and a price of $16.
英語のヒント
Authentic Chinese Pizza店が利潤を最大化するには、限界収入と限界費用が等しい数量、つまりMR = MCとなるQを選ぶ。この場合は数量40、価格16ドルを選ぶ。
Quantity 数量 |
Price 価格 |
Total Revenue 総収入 |
Marginal Revenue 限界収入 |
Total Cost 総費用 |
Marginal Cost 限界費用 |
Average Cost 平均費用 |
|---|---|---|---|---|---|---|
10 |
$23 |
$230 |
$23 |
$340 |
$34 |
$34 |
20 |
$20 |
$400 |
$17 |
$400 |
$6 |
$20 |
30 |
$18 |
$540 |
$14 |
$480 |
$8 |
$16 |
40 |
$16 |
$640 |
$10 |
$580 |
$10 |
$14.50 |
50 |
$14 |
$700 |
$6 |
$700 |
$12 |
$14 |
60 |
$12 |
$720 |
$2 |
$840 |
$14 |
$14 |
70 |
$10 |
$700 |
–$2 |
$1,020 |
$18 |
$14.57 |
80 |
$8 |
$640 |
–$6 |
$1,280 |
$26 |
$16 |
We can multiply the combinations of price and quantity at each point on the demand curve to calculate the total revenue that the firm would receive, which is in the third column of Table 10.1. We calculate marginal revenue, in the fourth column, as the change in total revenue divided by the change in quantity. The final columns of Table 10.1 show total cost, marginal cost, and average cost. As always, we calculate marginal cost by dividing the change in total cost by the change in quantity, while we calculate average cost by dividing total cost by quantity. The following Work It Out feature shows how these firms calculate how much of their products to supply at what price.
英語のヒント
Although the process by which a monopolistic competitor makes decisions about quantity and price is similar to the way in which a monopolist makes such decisions, two differences are worth remembering. First, although both a monopolist and a monopolistic competitor face downward-sloping demand curves, the monopolist’s perceived demand curve is the market demand curve, while the perceived demand curve for a monopolistic competitor is based on the extent of its product differentiation and how many competitors it faces. Second, a monopolist is surrounded by barriers to entry and need not fear entry, but a monopolistic competitor who earns profits must expect the entry of firms with similar, but differentiated, products.
英語のヒント
独占的競争企業が数量と価格を決める過程は、独占企業の決め方と似ているが、覚えておくべき相違点が2つある。第1に、どちらも右下がりの需要曲線に直面するものの、独占企業が認識する需要曲線は市場需要曲線であるのに対し、独占的競争企業のそれは、製品差別化の程度と直面する競争相手の数によって決まる。第2に、独占企業は参入障壁に囲まれていて参入を恐れる必要がないが、利潤を得ている独占的競争企業は、類似しているが差別化された製品を持つ企業の参入を予想しなければならない。