第4章微分の応用
Failures of Newton’s Methodニュートン法がうまくいかない場合
Typically, Newton’s method is used to find roots fairly quickly. However, things can go wrong. Some reasons why Newton’s method might fail include the following:
ニュートン法は通常、根をかなり速く求められる。しかし、うまくいかないこともある。その理由には、次のようなものがある。
- At one of the approximations the derivative is zero at but As a result, the tangent line of at does not intersect the -axis. Therefore, we cannot continue the iterative process.途中の近似値において、導関数はで0だが、である。この場合、でのの接線は軸と交わらず、反復を続けられない。
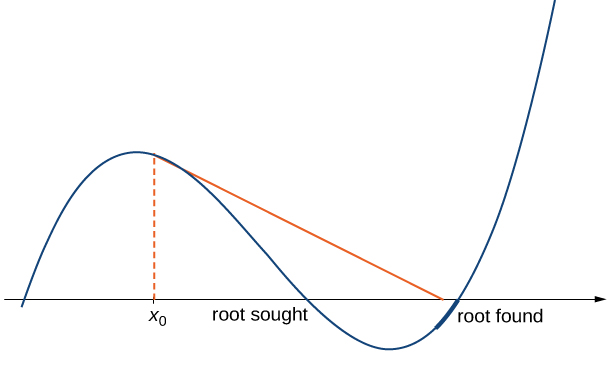
- The approximations may approach a different root. If the function has more than one root, it is possible that our approximations do not approach the one for which we are looking, but approach a different root (see Figure 4.80). This event most often occurs when we do not choose the approximation close enough to the desired root.
英語のヒント
近似値が、目的とは違う根に近づくことがある。関数が複数の根を持つ場合、探していた根とは別の根へ近づく可能性がある(図4.80)。これは、最初の近似値を、求めたい根に十分近く選ばなかったときに起こりやすい。 - The approximations may fail to approach a root entirely. In Example 4.48, we provide an example of a function and an initial guess such that the successive approximations never approach a root because the successive approximations continue to alternate back and forth between two values.
英語のヒント
近似値が、どの根にも近づかないことがある。例題4.48では、ある関数と初期値に対して、近似値が2つの値を交互に行き来し続け、根に近づかない例を示す。
OpenStax, Rice University; Calculus Volume 1. · CC BY-NC-SA 4.0
Figure 4.80図 4.80
If the initial guess is too far from the root sought, it may lead to approximations that approach a different root.
初期値が求めたい根から離れすぎていると、近似値が別の根へ向かうことがある。
Example 4.48例題 4.48
When Newton’s Method Failsニュートン法が失敗する例
Consider the function Let Show that the sequence fails to approach a root of
関数を考え、とする。数列がの根に近づかないことを示せ。
Solution解き方
For the derivative is Therefore,
の導関数はである。したがって、
In the next step,
次の段階では、
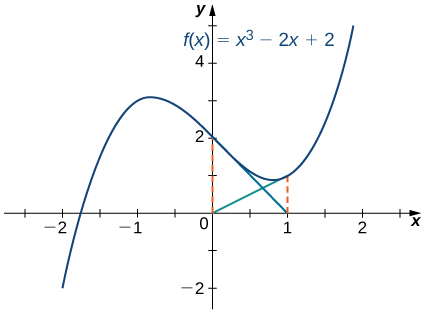
Consequently, the numbers continue to bounce back and forth between and and never get closer to the root of which is over the interval (see Figure 4.81). Fortunately, if we choose an initial approximation closer to the actual root, we can avoid this situation.
このため、はとの間を行き来し続け、区間にあるの根には近づかない(図4.81)。実際の根にもっと近い初期値を選べば、この状況を避けられる。
OpenStax, Rice University; Calculus Volume 1. · CC BY-NC-SA 4.0
Figure 4.81図 4.81
The approximations continue to alternate between and never approach the root of
近似値はの間を交互に行き来し、の根に近づかない。
From Example 4.48, we see that Newton’s method does not always work. However, when it does work, the sequence of approximations approaches the root very quickly. Discussions of how quickly the sequence of approximations approach a root found using Newton’s method are included in texts on numerical analysis.
英語のヒント
例題4.48のとおり、ニュートン法が常に成功するとは限らない。しかし、うまくいく場合には、近似値の列は根に非常に速く近づく。その収束の速さについては、数値解析の教科書で詳しく扱われる。
Other Iterative Processesほかの反復過程
As mentioned earlier, Newton’s method is a type of iterative process. We now look at an example of a different type of iterative process.
ニュートン法は反復過程の1つである。ここでは、別の種類の反復過程を見よう。
Consider a function and an initial number Define the subsequent numbers by the formula This process is an iterative process that creates a list of numbers This list of numbers may approach a finite number as gets larger, or it may not. In Example 4.49, we see an example of a function and an initial guess such that the resulting list of numbers approaches a finite value.
英語のヒント
関数と初期値を考える。それに続くを、公式で定義する。この反復によって、数列が作られる。を大きくしていくと、この数列は有限の値へ近づくかもしれないし、そうでないかもしれない。例題4.49では、関数と初期値を選ぶと、得られる数列が有限の値へ近づく例を見る。
Example 4.49例題 4.49
Finding a Limit for an Iterative Process反復過程の極限を求める
Let and let For all let Find the values Make a conjecture about what happens to this list of numbers as If the list of numbers approaches a finite number then satisfies and is called a fixed point of
英語のヒント
、とする。すべてのについてと定め、を求めよ。のとき、この数列がどうなるかを推測せよ。数列が有限の値へ近づくなら、この連続な関数でははを満たす。をの不動点という。
Solution解き方
If then
ならば、
From this list, we conjecture that the values approach
これらの値から、はに近づくと予想できる。
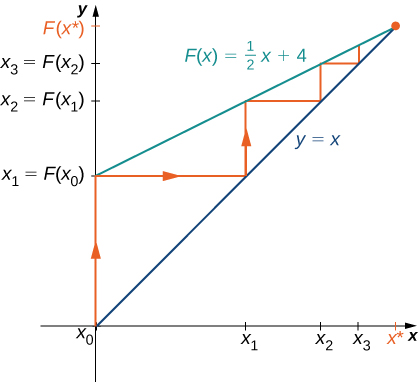
Figure 4.82 provides a graphical argument that the values approach as Starting at the point we draw a vertical line to the point The next number in our list is We use to calculate Therefore, we draw a horizontal line connecting to the point on the line and then draw a vertical line connecting to the point The output becomes Continuing in this way, we could create an infinite number of line segments. These line segments are trapped between the lines and The line segments get closer to the intersection point of these two lines, which occurs when Solving the equation we conclude they intersect at Therefore, our graphical evidence agrees with our numerical evidence that the list of numbers approaches as
図4.82は、のとき値がへ近づくことを、グラフで説明している。点から鉛直線を引き、点へ進む。数列の次の値はである。からを計算するため、から水平線を引き、直線上の点へ進む。そこから鉛直線でとを結ぶ。出力が次の値になる。この操作を続ければ、線分をいくらでも作れる。それらはとの2直線の間に収まり、2直線の交点へ近づく。交点ではなので、を解くととわかる。こうして、グラフからも数値計算からも、のとき数列はへ近づくと考えられる。
OpenStax, Rice University; Calculus Volume 1. · CC BY-NC-SA 4.0
Figure 4.82図 4.82
This iterative process approaches the value
この反復過程は、へ近づく。
Checkpoint 4.48確認問題 4.48
Consider the function Let and let for Find Make a conjecture about what happens to the list of numbers as
関数を考える。とし、についてとする。を求めよ。のとき数列がどうなるかを推測せよ。
Solution解き方
Hintヒント
Consider the point where the lines and intersect.
直線との交点を考える。
Project探究課題
Iterative Processes and Chaos反復過程とカオス
Iterative processes can yield some very interesting behavior. In this section, we have seen several examples of iterative processes that converge to a fixed point. We also saw in Example 4.48 that the iterative process bounced back and forth between two values. We call this kind of behavior a -cycle. Iterative processes can converge to cycles with various periodicities, such as (where the iterative process repeats a sequence of four values), 8-cycles, and so on.
英語のヒント
反復過程は、興味深い振る舞いを生む。この節では、不動点へ収束する例をいくつか見た。例題4.48では、2つの値の間を行き来し続ける例も見た。この振る舞いを周期のサイクルという。反復過程は、周期(4つの値を順に繰り返す場合)、周期8など、さまざまな周期のサイクルへ近づくことがある。
Some iterative processes yield what mathematicians call chaos. In this case, the iterative process jumps from value to value in a seemingly random fashion and never converges or settles into a cycle. Although a complete exploration of chaos is beyond the scope of this text, in this project we look at one of the key properties of a chaotic iterative process: sensitive dependence on initial conditions. This property refers to the concept that small changes in initial conditions can generate drastically different behavior in the iterative process.
英語のヒント
数学者がカオスと呼ぶ振る舞いを生む反復過程もある。この場合、値は一見でたらめに飛び移り、1つの値へ収束することも、一定の周期に落ち着くこともない。カオス全体を詳しく調べることは本書の範囲を超えるが、この探究では重要な性質の1つ、「初期条件への鋭敏な依存性」を取り上げる。これは、初期条件のわずかな違いが、反復過程で大きく異なる振る舞いを生みうるという性質である。
Probably the best-known example of chaos is the Mandelbrot set (see Figure 4.83), named after Benoit Mandelbrot (1924–2010), who investigated its properties and helped popularize the field of chaos theory. The Mandelbrot set is usually generated by computer and shows fascinating details on enlargement, including self-replication of the set. Several colorized versions of the set have been shown in museums and can be found online and in popular books on the subject.
英語のヒント
カオスに関係する最も有名な例の1つは、マンデルブロ集合だろう(図4.83)。この名は、その性質を研究し、カオス理論の普及に貢献したブノワ・マンデルブロ(1924–2010)に由来する。マンデルブロ集合は通常コンピューターで描かれる。拡大すると、集合に似た形が繰り返し現れるなど、興味深い細部が見える。色を付けた図は美術館などで展示され、インターネットや一般向けの本でも見られる。

OpenStax, Rice University; Calculus Volume 1. · CC BY-NC-SA 4.0
Figure 4.83図 4.83
The Mandelbrot set is a well-known example of a set of points generated by the iterative chaotic behavior of a relatively simple function.
マンデルブロ集合は、比較的単純な関数の反復から生じる複雑な振る舞いに関係する、有名な点集合である。
In this project we use the logistic map
この探究では、次のロジスティック写像を使う。
as the function in our iterative process. The logistic map is a deceptively simple function; but, depending on the value of the resulting iterative process displays some very interesting behavior. It can lead to fixed points, cycles, and even chaos.
英語のヒント
これを反復過程の関数とする。ロジスティック写像は一見単純だが、の値によって実にさまざまな振る舞いを示す。不動点、周期的なサイクル、さらにはカオスも生じる。
To visualize the long-term behavior of the iterative process associated with the logistic map, we will use a tool called a cobweb diagram. As we did with the iterative process we examined earlier in this section, we first draw a vertical line from the point to the point We then draw a horizontal line from that point to the point then draw a vertical line to and continue the process until the long-term behavior of the system becomes apparent. Figure 4.84 shows the long-term behavior of the logistic map when and (The first iterations are not plotted.) The long-term behavior of this iterative process is an -cycle.
英語のヒント
ロジスティック写像の反復を長く続けたときの振る舞いを見るため、「クモの巣図」という道具を使う。先ほどの反復過程と同じように、まず点から点へ鉛直線を引く。そこから点まで水平線を引き、次にへ鉛直線を引く。この操作を、長期的な振る舞いが見えるまで続ける。図4.84は、、の場合の長期的な振る舞いである。最初の回の反復は表示していない。この場合は、周期のサイクルに近づく。

OpenStax, Rice University; Calculus Volume 1. · CC BY-NC-SA 4.0
Figure 4.84図 4.84
A cobweb diagram for is presented here. The sequence of values results in an -cycle.
のクモの巣図。値の列は周期のサイクルに近づく。
- Let and choose Either by hand or by using a computer, calculate the first values in the sequence. Does the sequence appear to converge? If so, to what value? Does it result in a cycle? If so, what kind of cycle (for example,、とする。手計算またはコンピューターで、数列の最初の個の値を計算せよ。数列は収束しそうか。そうなら、どの値に収束するか。サイクルになるか。そうなら、どの周期のサイクルか(たとえば周期)を答えよ。
- What happens whenの場合には、どうなるか。
- For and calculate the first sequence values. Generate a cobweb diagram for each iterative process. (Several free applets are available online that generate cobweb diagrams for the logistic map.) What is the long-term behavior in each of these cases?とについて、数列の最初の個の値を計算せよ。それぞれの反復過程のクモの巣図を作れ。ロジスティック写像のクモの巣図を作る無料のツールは、オンラインにもある。それぞれ、長く反復するとどのような振る舞いになるか。
- Now let Calculate the first sequence values and generate a cobweb diagram. What is the long-term behavior in this case?次に、とする。数列の最初の個の値を計算し、クモの巣図を作れ。この場合の長期的な振る舞いはどうなるか。
- Repeat the process for but let How does this behavior compare with the behavior forのまま、初期値をに変えて繰り返せ。の場合と比べて、どのような違いがあるか。