第4章微分の応用
Determining End Behavior for Transcendental Functions超越関数の無限遠での振る舞い
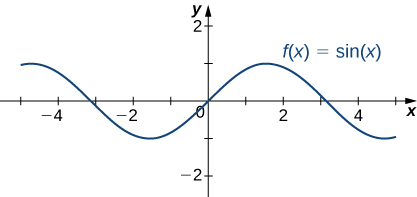
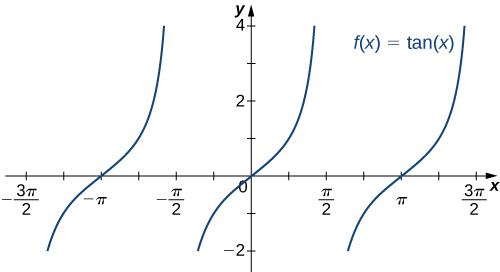
The six basic trigonometric functions are periodic and do not approach a finite limit as For example, oscillates between (Figure 4.58). The tangent function has an infinite number of vertical asymptotes as therefore, it does not approach a finite limit nor does it approach as as shown in Figure 4.59.
OpenStax, Rice University; Calculus Volume 1. · CC BY-NC-SA 4.0
Figure 4.58図 4.58
The function oscillates between as
関数は、のときもの間を振動し続ける。
OpenStax, Rice University; Calculus Volume 1. · CC BY-NC-SA 4.0
Figure 4.59図 4.59
The function does not approach a limit and does not approach as
関数は、のとき有限の極限値へ近づかず、へ発散することもない。
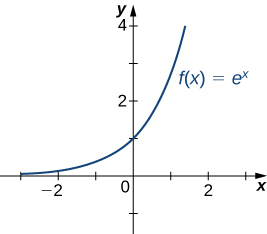
Recall that for any base the function is an exponential function with domain and range If is increasing over If is decreasing over For the natural exponential function Therefore, is increasing on and the range is The exponential function approaches as and approaches as as shown in Table 4.5 and Figure 4.60.
OpenStax, Rice University; Calculus Volume 1. · CC BY-NC-SA 4.0
Figure 4.60図 4.60
The exponential function approaches zero as and approaches as
指数関数は、のとき0へ近づき、のときへ発散する。
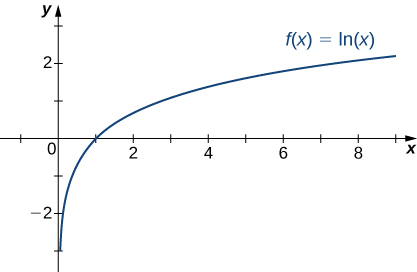
Recall that the natural logarithm function is the inverse of the natural exponential function Therefore, the domain of is and the range is The graph of is the reflection of the graph of about the line Therefore, as and as as shown in Figure 4.61 and Table 4.6.
OpenStax, Rice University; Calculus Volume 1. · CC BY-NC-SA 4.0
Figure 4.61図 4.61
The natural logarithm function approaches as
自然対数関数は、のときへ発散する。
Example 4.27例題 4.27
Determining End Behavior for a Transcendental Function超越関数の無限遠での振る舞いを調べる
Find the limits as and for and describe the end behavior of
について、とのときの極限を求め、の無限遠での振る舞いを説明せよ。
Solution解き方
To find the limit as divide the numerator and denominator by
のときの極限を求めるため、分子と分母をで割る。
As shown in Figure 4.60, as Therefore,
図4.60のとおり、のときとなる。したがって、
We conclude that and the graph of approaches the horizontal asymptote as To find the limit as use the fact that as to conclude that and therefore the graph of approaches the horizontal asymptote as
よって、であり、のときのグラフは水平漸近線へ近づく。のときの極限は、ならとなることを使って求めると、である。したがって、のとき、このグラフは水平漸近線へ近づく。
Guidelines for Drawing the Graph of a Function関数のグラフを描くための指針
We now have enough analytical tools to draw graphs of a wide variety of algebraic and transcendental functions. Before showing how to graph specific functions, let’s look at a general strategy to use when graphing any function.
英語のヒント
これまでに、さまざまな代数関数や超越関数のグラフを描くための道具が揃った。個々の関数を描く前に、一般的に使える手順を整理しよう。
Now let’s use this strategy to graph several different functions. We start by graphing a polynomial function.
この手順で、いくつかの関数のグラフを描こう。まず、多項式関数から始める。
Example 4.28例題 4.28
Sketching a Graph of a Polynomial多項式関数のグラフの概形を描く
Sketch a graph of
のグラフの概形を描け。
Solution解き方
Step 1. Since is a polynomial, the domain is the set of all real numbers.
手順1.は多項式なので、定義域は実数全体である。
Step 2. When Therefore, the -intercept is To find the -intercepts, we need to solve the equation gives us the -intercepts and
手順2.なので、切片はである。切片を求めるには、方程式を解く。その結果、切片はとである。
Step 3. We need to evaluate the end behavior of As and Therefore, As and Therefore, To get even more information about the end behavior of we can multiply the factors of When doing so, we see that
手順3.の無限遠での振る舞いを調べる。のとき、かつなので、となる。のとき、かつなので、となる。の無限遠での振る舞いをさらに詳しく調べるため、の因子を掛けて展開すると、
Since the leading term of is we conclude that behaves like as
の最高次の項はなので、のときはと同じ向きに発散し、主要な増大率も等しい。
Step 4. Since is a polynomial function, it does not have any vertical asymptotes.
手順4.は多項式関数なので、垂直漸近線をもたない。
Step 5. The first derivative of is
手順5.の第1次導関数は、
Therefore, has two critical points: Divide the interval into the three smaller intervals: and Then, choose test points and from these intervals and evaluate the sign of at each of these test points, as shown in the following table.
したがって、にはという二つの臨界点がある。区間を、、、の三つに分ける。各区間から調べる点として、、を選び、それぞれでの符号を調べる。結果を次の表に示す。
Interval 区間 |
Test Point 調べる点 |
Sign of Derivative 導関数の符号 |
Conclusion 結論 |
|---|---|---|---|
is increasing. は増加している。 |
|||
is decreasing. は減少している。 |
|||
is increasing. は増加している。 |
From the table, we see that has a local maximum at and a local minimum at Evaluating at those two points, we find that the local maximum value is and the local minimum value is
表から、はで極大値、で極小値をとる。この2点でを計算すると、極大値は、極小値はである。
Step 6. The second derivative of is
手順6.の第2次導関数は、
The second derivative is zero at Therefore, to determine the concavity of divide the interval into the smaller intervals and and choose test points and to determine the concavity of on each of these smaller intervals as shown in the following table.
第2次導関数はで0になる。そこでの凹凸を調べるため、区間をとに分ける。各区間からとを選び、そこでの符号から各区間におけるの凹凸を判定する。結果を次の表に示す。
Interval 区間 |
Test Point 調べる点 |
Sign of の符号 |
Conclusion 結論 |
|---|---|---|---|
is concave down. は上に凸である。 |
|||
is concave up. は下に凸である。 |
We note that the information in the preceding table confirms the fact, found in step that has a local maximum at and a local minimum at In addition, the information found in step —namely, has a local maximum at and a local minimum at and at those points—combined with the fact that changes sign only at confirms the results found in step on the concavity of
直前の表は、手順で求めた「がで極大値、で極小値をとる」という結果も裏付ける。これらの点では第2次導関数がそれぞれ負・正だからである。逆に、手順で得た「はで極大、で極小となり、両点でである」という結果と、この例では第2次導関数が両点で0でなく、の符号が変わるのはだけであることを合わせても、手順のの凹凸を確認できる。
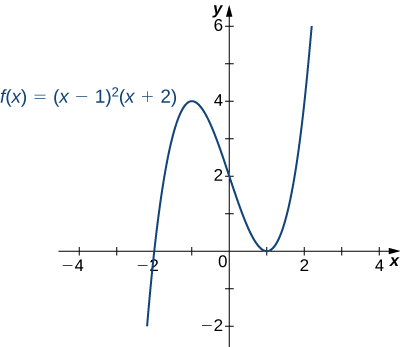
Combining this information, we arrive at the graph of shown in the following graph.
以上をまとめると、のグラフは次のようになる。
OpenStax, Rice University; Calculus Volume 1. · CC BY-NC-SA 4.0
Example 4.29例題 4.29
Sketching a Rational Function有理関数のグラフの概形を描く
Sketch the graph of
のグラフの概形を描け。
Solution解き方
Step 1. The function is defined as long as the denominator is not zero. Therefore, the domain is the set of all real numbers except
手順1.は分母が0でない限り定義される。したがって、定義域はを除くすべての実数である。
Step 2. Find the intercepts. If then so is an intercept. If then which implies Therefore, is the only intercept.
手順2.切片を求める。ならなので、y切片はである。ならであり、ここからとなる。したがって、座標軸との交点はだけである。
Step 3. Evaluate the limits at infinity. Since is a rational function, divide the numerator and denominator by the highest power in the denominator: We obtain
手順3.無限遠での極限を求める。は有理関数なので、分子と分母を、分母の最高の累乗で割る。すると、
Therefore, has a horizontal asymptote of as and
したがって、は、との両方で、水平漸近線をもつ。
Step 4. To determine whether has any vertical asymptotes, first check to see whether the denominator has any zeroes. We find the denominator is zero when To determine whether the lines or are vertical asymptotes of evaluate and By looking at each one-sided limit as we see that
手順4.に垂直漸近線があるか調べるため、まず分母が0になる点を探す。その点はである。直線とがの垂直漸近線かどうかを判定するため、とを調べる。の左右からの極限を見ると、
In addition, by looking at each one-sided limit as we find that
さらに、の左右からの極限を見ると、
Step 5. Calculate the first derivative:
手順5.第1次導関数を計算する。
Critical points occur at points where or is undefined. We see that when The derivative is not undefined at any point in the domain of However, are not in the domain of Therefore, to determine where is increasing and where is decreasing, divide the interval into four smaller intervals: and and choose a test point in each interval to determine the sign of in each of these intervals. The values and are good choices for test points as shown in the following table.
臨界点は、定義域内でとなるか、が定義されない点である。ここでは、のときとなる。の定義域内にはが定義されない点はない。はの定義域に含まれない。それも考慮して、が増加する区間とが減少する区間を調べるため、を、、、に分ける。各区間で一点ずつ選び、の符号を調べる。例えば、、、を選ぶと、次の表が得られる。
Interval 区間 |
Test Point 調べる点 |
Sign of の符号 |
Conclusion 結論 |
|---|---|---|---|
is decreasing. は減少している。 |
|||
is decreasing. は減少している。 |
|||
is increasing. は増加している。 |
|||
is increasing. は増加している。 |
From this analysis, we conclude that has a local minimum at but no local maximum.
以上より、はで極小値をとるが、極大値はもたない。
Step 6. Calculate the second derivative:
手順6.第2次導関数を計算する。
To determine the intervals where is concave up and where is concave down, we first need to find all points where or is undefined. Since the numerator for any is never zero. Furthermore, is not undefined for any in the domain of However, as discussed earlier, are not in the domain of Therefore, to determine the concavity of we divide the interval into the three smaller intervals and and choose a test point in each of these intervals to evaluate the sign of in each of these intervals. The values and are possible test points as shown in the following table.
が下に凸となる区間とが上に凸となる区間を調べるため、まずとなるかが定義されない点を探す。どのについても分子はなので、は0にならない。また、の定義域内のどのでも、は定義される。既に述べたように、はの定義域に含まれない。の凹凸を調べるため、を、、に分け、各区間で一点ずつ選んでの符号を調べる。例えば、、を選ぶと、次の表が得られる。
Interval 区間 |
Test Point 調べる点 |
Sign of の符号 |
Conclusion 結論 |
|---|---|---|---|
is concave down. は上に凸である。 |
|||
is concave up. は下に凸である。 |
|||
is concave down. は上に凸である。 |
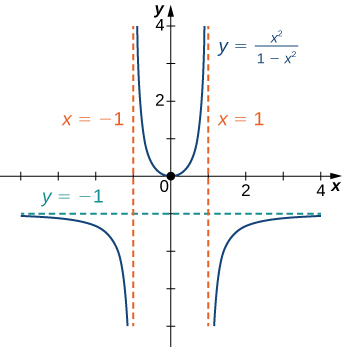
Combining all this information, we arrive at the graph of shown below. Note that, although changes concavity at and there are no inflection points at either of these places because is not continuous at or
以上をまとめると、のグラフは次のようになる。はとを境に凹凸が変わるが、どちらにも変曲点はない。はでもでも連続ではなく、そもそもそこで定義されないからである。
OpenStax, Rice University; Calculus Volume 1. · CC BY-NC-SA 4.0
Example 4.30例題 4.30
Sketching a Rational Function with an Oblique Asymptote斜漸近線をもつ有理関数のグラフ
Sketch the graph of
のグラフの概形を描け。
Solution解き方
Step 1. The domain of is the set of all real numbers except
手順1.の定義域は、を除くすべての実数である。
Step 2. Find the intercepts. We can see that when so is the only intercept.
手順2.切片を求める。のときであり、分子が0になるのもこのときだけなので、座標軸との交点はだけである。
Step 3. Evaluate the limits at infinity. Since the degree of the numerator is one more than the degree of the denominator, must have an oblique asymptote. To find the oblique asymptote, use long division of polynomials to write
手順3.無限遠での極限を求める。分子の次数が分母の次数より1大きいので、は斜漸近線をもつ。多項式の割り算を使って、
Since as approaches the line as The line is an oblique asymptote for
のときなので、のときは直線へ近づく。直線がの斜漸近線である。
Step 4. To check for vertical asymptotes, look at where the denominator is zero. Here the denominator is zero at Looking at both one-sided limits as we find
手順4.垂直漸近線を調べるため、分母が0になる点を探す。ここではである。の左右からの極限を調べると、
Therefore, is a vertical asymptote, and we have determined the behavior of as approaches from the right and the left.
したがって、は垂直漸近線である。これで、がへ右から、また左から近づくときのの振る舞いも分かった。
Step 5. Calculate the first derivative:
手順5.第1次導関数を計算する。
We have when Therefore, and are critical points. Since is undefined at we need to divide the interval into the smaller intervals and and choose a test point from each interval to evaluate the sign of in each of these smaller intervals. For example, let and be the test points as shown in the following table.
のときとなるので、とが臨界点である。はで定義されないことも考慮する。を、、、に分け、各区間から一点ずつ選んでの符号を調べる。例えば、、、を選ぶと、次の表が得られる。
Interval 区間 |
Test Point 調べる点 |
Sign of の符号 |
Conclusion 結論 |
|---|---|---|---|
is increasing. は増加している。 |
|||
is decreasing. は減少している。 |
|||
is decreasing. は減少している。 |
|||
is increasing. は増加している。 |
From this table, we see that has a local maximum at and a local minimum at The value of at the local maximum is and the value of at the local minimum is Therefore, and are important points on the graph.
この表から、はで極大値、で極小値をとる。の極大値は、の極小値はである。したがって、とはグラフを描くうえで重要な点となる。
Step 6. Calculate the second derivative:
手順6.第2次導関数を計算する。
We see that is never zero or undefined for in the domain of Since is undefined at to check concavity we just divide the interval into the two smaller intervals and and choose a test point from each interval to evaluate the sign of in each of these intervals. The values and are possible test points as shown in the following table.
の定義域内のについて、は0にも未定義にもならない。はで定義されないので、凹凸を調べるには、をとに分ければよい。各区間から一点ずつ選び、の符号を調べる。例えばとを選ぶと、次の表が得られる。
Interval 区間 |
Test Point 調べる点 |
Sign of の符号 |
Conclusion 結論 |
|---|---|---|---|
is concave down. は上に凸である。 |
|||
is concave up. は下に凸である。 |
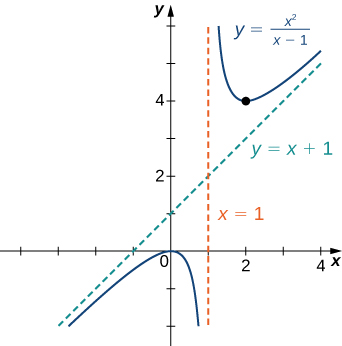
From the information gathered, we arrive at the following graph for
以上の情報から、のグラフは次のようになる。
OpenStax, Rice University; Calculus Volume 1. · CC BY-NC-SA 4.0
Example 4.31例題 4.31
Sketching the Graph of a Function with a Cusp尖点をもつ関数のグラフ
Sketch a graph of
のグラフの概形を描け。
Solution解き方
Step 1. Since the cube-root function is defined for all real numbers and the domain of is all real numbers.
手順1.立方根はすべての実数について定義され、である。したがって、の定義域は実数全体である。
Step 2: To find the -intercept, evaluate Since the -intercept is To find the -intercept, solve The solution of this equation is so the -intercept is
手順2.切片を求めるため、を計算する。なので、切片はである。切片を求めるには、を解く。解はなので、切片はである。
Step 3: Since the function continues to grow without bound as and
手順3.なので、のときものときも、関数の値は限りなく大きくなる。
Step 4: The function has no vertical asymptotes.
手順4.この関数には垂直漸近線がない。
Step 5: To determine where is increasing or decreasing, calculate We find
手順5.の増減を調べるため、を計算する。すると、
This function is not zero anywhere, but it is undefined when Therefore, the only critical point is Divide the interval into the smaller intervals and and choose test points in each of these intervals to determine the sign of in each of these smaller intervals. Let and be the test points as shown in the following table.
この導関数はどこでも0にならないが、で定義されない。したがって、唯一の臨界点はである。をとに分け、各区間で一点ずつ選んでの符号を調べる。とを選ぶと、次の表が得られる。
Interval 区間 |
Test Point 調べる点 |
Sign of の符号 |
Conclusion 結論 |
|---|---|---|---|
is decreasing. は減少している。 |
|||
is increasing. は増加している。 |
We conclude that has a local minimum at Evaluating at we find that the value of at the local minimum is zero. Note that is undefined, so to determine the behavior of the function at this critical point, we need to examine Looking at the one-sided limits, we have
以上より、はで極小値をとる。におけるを計算すると、の極小値は0である。は定義されないので、この臨界点でのグラフの形を詳しく知るには、を調べる必要がある。左右からの極限は、
Therefore, has a cusp at
したがって、はに尖点をもつ。
Step 6: To determine concavity, we calculate the second derivative of
手順6.凹凸を調べるため、の第2次導関数を計算する。
We find that is defined for all but is undefined when Therefore, divide the interval into the smaller intervals and and choose test points to evaluate the sign of in each of these intervals. As we did earlier, let and be test points as shown in the following table.
はでは定義されず、それ以外のすべてので定義される。そこで、をとに分け、各区間での符号を調べる。先ほどと同じく、調べる点をとに選ぶと、次の表が得られる。
Interval 区間 |
Test Point 調べる点 |
Sign of の符号 |
Conclusion 結論 |
|---|---|---|---|
is concave down. は上に凸である。 |
|||
is concave down. は上に凸である。 |
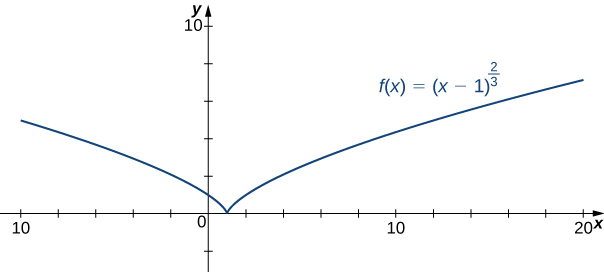
From this table, we conclude that is concave down everywhere. Combining all of this information, we arrive at the following graph for
表から、は尖点の左側・右側の各区間で上に凸である。以上をまとめると、のグラフは次のようになる。
OpenStax, Rice University; Calculus Volume 1. · CC BY-NC-SA 4.0