第4章微分の応用
4.6 Limits at Infinity and Asymptotes4.6 無限遠での極限と漸近線
Learning Objectives学習目標
- Calculate the limit of a function as increases or decreases without bound.が正または負の方向へ限りなく進むときの関数の極限を計算する。
- Recognize a horizontal asymptote on the graph of a function.関数のグラフの水平漸近線を見つける。
- Estimate the end behavior of a function as increases or decreases without bound.が正または負の方向へ限りなく進むときの関数の振る舞いを推定する。
- Recognize an oblique asymptote on the graph of a function.関数のグラフの斜漸近線を見つける。
- Analyze a function and its derivatives to draw its graph.関数とその導関数を調べ、グラフを描く。
We have shown how to use the first and second derivatives of a function to describe the shape of a graph. To graph a function defined on an unbounded domain, we also need to know the behavior of as In this section, we define limits at infinity and show how these limits affect the graph of a function. At the end of this section, we outline a strategy for graphing an arbitrary function
英語のヒント
第1次・第2次導関数を使ってグラフの形を調べる方法を学んだ。有界でない定義域をもつ関数のグラフを描くには、のときのの振る舞いも知る必要がある。この節では無限遠での極限を定義し、それがグラフの形とどう関わるかを調べる。最後に、任意の関数のグラフを描く手順をまとめる。
Limits at Infinity無限遠での極限
We begin by examining what it means for a function to have a finite limit at infinity. Then we study the idea of a function with an infinite limit at infinity. Back in Introduction to Functions and Graphs, we looked at vertical asymptotes; in this section we deal with horizontal and oblique asymptotes.
英語のヒント
まず、無限遠で関数が有限の極限をもつとはどういうことかを考える。その後、無限遠で関数の値が無限大へ発散する場合を学ぶ。「関数とグラフへの導入」では垂直漸近線を扱った。この節では、水平漸近線と斜めの漸近線を扱う。
Limits at Infinity and Horizontal Asymptotes無限遠での極限と水平漸近線
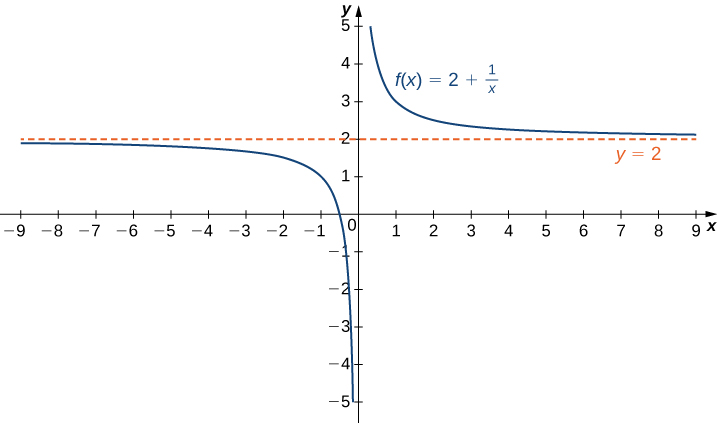
Recall that means becomes arbitrarily close to as long as is sufficiently close to We can extend this idea to limits at infinity. For example, consider the function As can be seen graphically in Figure 4.40 and numerically in Table 4.2, as the values of get larger, the values of approach We say the limit as approaches of is and write Similarly, for as the values get larger, the values of approaches We say the limit as approaches of is and write
英語のヒント
OpenStax, Rice University; Calculus Volume 1. · CC BY-NC-SA 4.0
Figure 4.40図 4.40
The function approaches the asymptote as approaches
がへ近づくと、関数のグラフは漸近線へ近づく。
More generally, for any function we say the limit as of is if becomes arbitrarily close to as long as is sufficiently large. In that case, we write Similarly, we say the limit as of is if becomes arbitrarily close to as long as and is sufficiently large. In that case, we write We now look at the definition of a function having a limit at infinity.
一般に、関数について、を十分大きくすればをへ望むだけ近づけられるとする。このとき、におけるの極限はであるといい、と書く。同様に、でを十分大きくすれば、をへ望むだけ近づけられるとする。このとき、におけるの極限はであるといい、と書く。無限遠で極限をもつことを、次のように定義しよう。
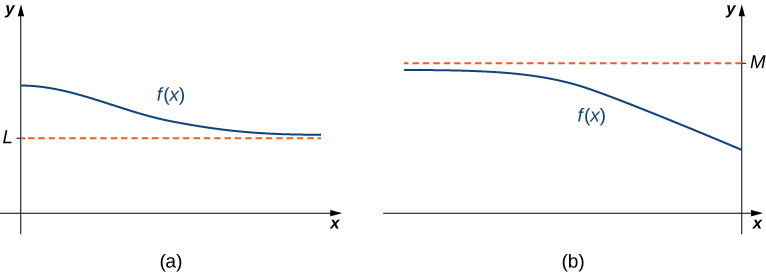
If the values are getting arbitrarily close to some finite value as or the graph of approaches the line In that case, the line is a horizontal asymptote of (Figure 4.41). For example, for the function since the line is a horizontal asymptote of
またはのときに、がある有限の値へ望むだけ近づくなら、のグラフは直線へ近づく。この直線を、の水平漸近線という(図4.41)。例えば、関数ではなので、直線はの水平漸近線である。
OpenStax, Rice University; Calculus Volume 1. · CC BY-NC-SA 4.0
Figure 4.41図 4.41
(a) As the values of are getting arbitrarily close to The line is a horizontal asymptote of (b) As the values of are getting arbitrarily close to The line is a horizontal asymptote of
(a) のとき、の値はへ望むだけ近づく。直線はの水平漸近線である。(b) のとき、の値はへ望むだけ近づく。直線はの水平漸近線である。
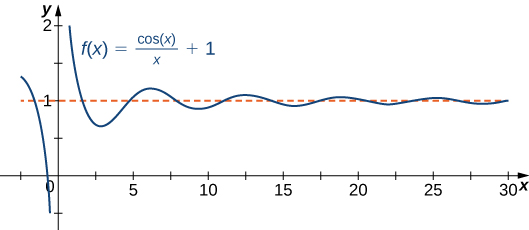
A function cannot cross a vertical asymptote because the graph must approach infinity (or from at least one direction as approaches the vertical asymptote. However, a function may cross a horizontal asymptote. In fact, a function may cross a horizontal asymptote an unlimited number of times. For example, the function shown in Figure 4.42 intersects the horizontal asymptote an infinite number of times as it oscillates around the asymptote with ever-decreasing amplitude.
英語のヒント
が垂直漸近線へ近づくとき、少なくとも一方の側では、関数値が正の無限大またはへ発散する。そのため、有限の高さを保った連続な曲線として垂直漸近線を横切ることはできない。一方、グラフが水平漸近線と交わることはある。無限回交わることさえある。例えば、図4.42の関数は、振幅を次第に小さくしながらの周りで振動し、この水平漸近線と無限回交わる。
OpenStax, Rice University; Calculus Volume 1. · CC BY-NC-SA 4.0
Figure 4.42図 4.42
The graph of crosses its horizontal asymptote an infinite number of times.
のグラフは、水平漸近線と無限回交わる。
The algebraic limit laws and squeeze theorem we introduced in Introduction to Limits also apply to limits at infinity. We illustrate how to use these laws to compute several limits at infinity.
「極限への導入」で学んだ極限の演算法則とはさみうちの定理は、無限遠での極限にも適用できる。これらを使って、いくつかの極限を計算しよう。
Example 4.21例題 4.21
Computing Limits at Infinity無限遠での極限を計算する
For each of the following functions evaluate and Determine the horizontal asymptote(s) for
次の各関数について、とを求めよ。また、の水平漸近線を求めよ。
Solution解き方
- Using the algebraic limit laws, we have
Similarly, Therefore, has a horizontal asymptote of and approaches this horizontal asymptote as as shown in the following graph.極限の演算法則を使うと、となる。同様に、である。したがって、の水平漸近線はであり、はのとき、この水平漸近線へ近づく。次のグラフを参照。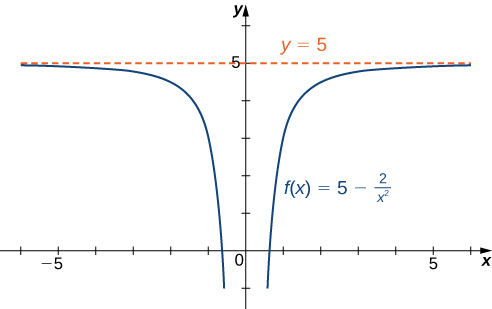
OpenStax, Rice University; Calculus Volume 1. · CC BY-NC-SA 4.0
Figure 4.43図 4.43This function approaches a horizontal asymptote asこの関数は、のときに水平漸近線へ近づく。 - Since for all we haveすべてのでなので、
for all Also, sinceこれはすべてのについて成り立つ。また、
we can apply the squeeze theorem to conclude thatしたがって、はさみうちの定理を適用すると、
Similarly,同様に、
Thus, has a horizontal asymptote of and approaches this horizontal asymptote as as shown in the following graph.よって、の水平漸近線はである。はのとき、この水平漸近線へ近づく。次のグラフを参照。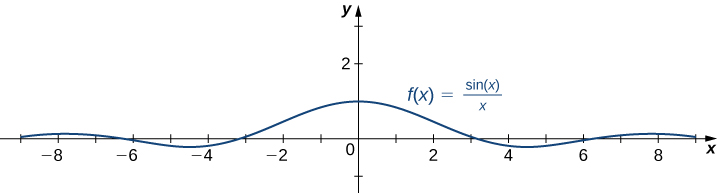
OpenStax, Rice University; Calculus Volume 1. · CC BY-NC-SA 4.0
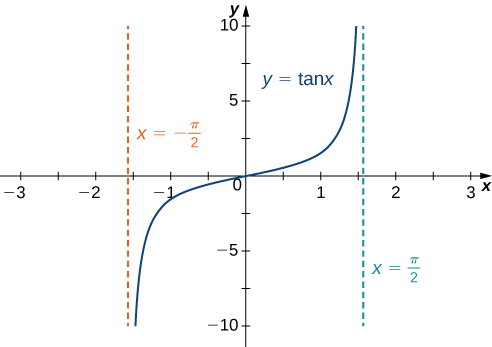
Figure 4.44図 4.44This function crosses its horizontal asymptote multiple times.この関数のグラフは、水平漸近線と何度も交わる。 - To evaluate and we first consider the graph of over the interval as shown in the following graph.とを求めるため、まず区間上ののグラフを考える。次の図を参照。
OpenStax, Rice University; Calculus Volume 1. · CC BY-NC-SA 4.0
Figure 4.45図 4.45The graph of has vertical asymptotes atのグラフは、に垂直漸近線をもつ。
Since
まず、次の極限が成り立つ。
it follows that
逆関数の関係から、次式が従う。
Similarly, since
同様に、次の極限も成り立つ。
it follows that
逆関数の関係から、次式が従う。
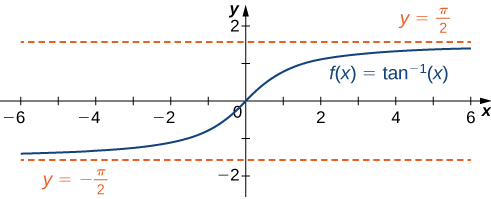
As a result, and are horizontal asymptotes of as shown in the following graph.
よって、とはの水平漸近線である。次の図に示す。
OpenStax, Rice University; Calculus Volume 1. · CC BY-NC-SA 4.0
Figure 4.46図 4.46
This function has two horizontal asymptotes.
この関数には二つの水平漸近線がある。