第4章微分の応用
Local Extrema and Critical Points極大値・極小値と臨界点
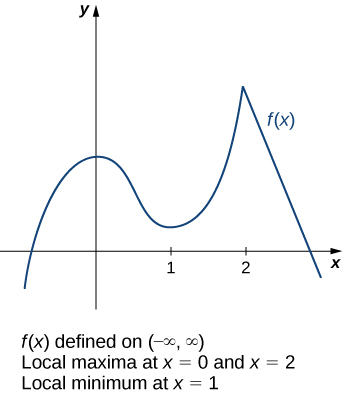
Consider the function shown in Figure 4.14. The graph can be described as two mountains with a valley in the middle. The absolute maximum value of the function occurs at the higher peak, at However, is also a point of interest. Although is not the largest value of the value is larger than for all near 0. We say has a local maximum at Similarly, the function does not have an absolute minimum, but it does have a local minimum at because is less than for near 1.
図4.14の関数を考える。二つの山があり、その間に谷がある形をしている。関数の最大値は、高いほうの山頂、で生じる。もう一つ、にも注目したい。は全体の最大値ではないが、0に近いすべてのに対して、は以上である。このようなとき、はで極大値(local maximum)をとるという。同様に、関数には最小値はないが、で極小値(local minimum)をとる。1に近いに対して、が以下だからである。
OpenStax, Rice University; Calculus Volume 1. · CC BY-NC-SA 4.0
Figure 4.14図 4.14
This function has two local maxima and one local minimum. The local maximum at is also the absolute maximum.
関数には二つの極大値と一つの極小値がある。での極大値は、関数全体の最大値でもある。
Note that if has an absolute extremum at and is defined over an interval containing then is also considered a local extremum. If an absolute extremum for a function occurs at an endpoint, we do not consider that to be a local extremum, but instead refer to that as an endpoint extremum.
がで最大値または最小値をとり、がを含む開区間で定義されていれば、は極値でもある。関数の最大値・最小値が区間の端点で生じる場合、本書ではそれを極値に含めず、端点での最大値・最小値として区別する。
Given the graph of a function it is sometimes easy to see where a local maximum or local minimum occurs. However, it is not always easy to see, since the interesting features on the graph of a function may not be visible because they occur at a very small scale. Also, we may not have a graph of the function. In these cases, how can we use a formula for a function to determine where these extrema occur?
英語のヒント
関数のグラフがあれば、極大・極小の位置を簡単に読み取れることもある。しかし、注目すべき変化が非常に小さい範囲で起こり、グラフでは見えない場合もある。そもそもグラフが手元にないかもしれない。そのようなとき、関数の式から、極大値・極小値をとる位置をどのように求めればよいだろうか。
To answer this question, let’s look at Figure 4.14 again. The local extrema occur at and Notice that at and the derivative At the derivative does not exist, since the function has a corner there. In fact, if has a local extremum at a point the derivative must satisfy one of the following conditions: either or is undefined. Such a value is known as a critical point and it is important in finding extreme values for functions.
図4.14をもう一度見よう。極値をとる位置は、、である。とでは、導関数の値はとなる。では関数に角があるため、導関数は存在しない。実際、がで極値をとるなら、導関数は、であるか、が定義されないかのいずれかである。このような値を臨界点と呼び、関数の最大・最小や極値を求める際の重要な候補となる。
As mentioned earlier, if has a local extremum at a point then must be a critical point of This fact is known as Fermat’s theorem.
先に述べたように、がで極値をとるならば、はの臨界点でなければならない。この事実のもとになるのがフェルマーの定理である。
Proof証明
Proof証明
Suppose has a local extremum at and is differentiable at We need to show that To do this, we will show that and and therefore Since has a local extremum at has a local maximum or local minimum at Suppose has a local maximum at The case in which has a local minimum at can be handled similarly. There then exists an open interval such that for all Since is differentiable at from the definition of the derivative, we know that
がで極値をとり、がで微分可能であると仮定する。示すべきことはである。との両方を示せば、が従う。はで極値をとるので、はで極大値または極小値をとる。まず、がで極大値をとる場合を考えよう。がで極小値をとる場合も同様に扱える。このとき、cを含む開区間が存在し、すべてのに対してが成り立つ。はで微分可能なので、導関数の定義より、次式が成り立つ。
Since this limit exists, both one-sided limits also exist and equal Therefore,
この極限が存在するので、左右の片側極限もどちらも存在し、に等しい。したがって、
and
また、
Since is a local maximum, we see that for near Therefore, for near but we have From Equation 4.4 we conclude that Similarly, it can be shown that Therefore,
は極大値なので、に近いに対してとなる。よって、に近く、かつを満たすについて、である。式4.4から、が従う。同様に、左側から近づけるとを示せる。以上から、である。
□
□
From Fermat’s theorem, we conclude that if has a local extremum at then either or is undefined. In other words, local extrema can only occur at critical points.
フェルマーの定理から、がで極値をとるなら、であるか、が定義されないかのいずれかであると分かる。つまり、極値が生じうるのは臨界点だけである。
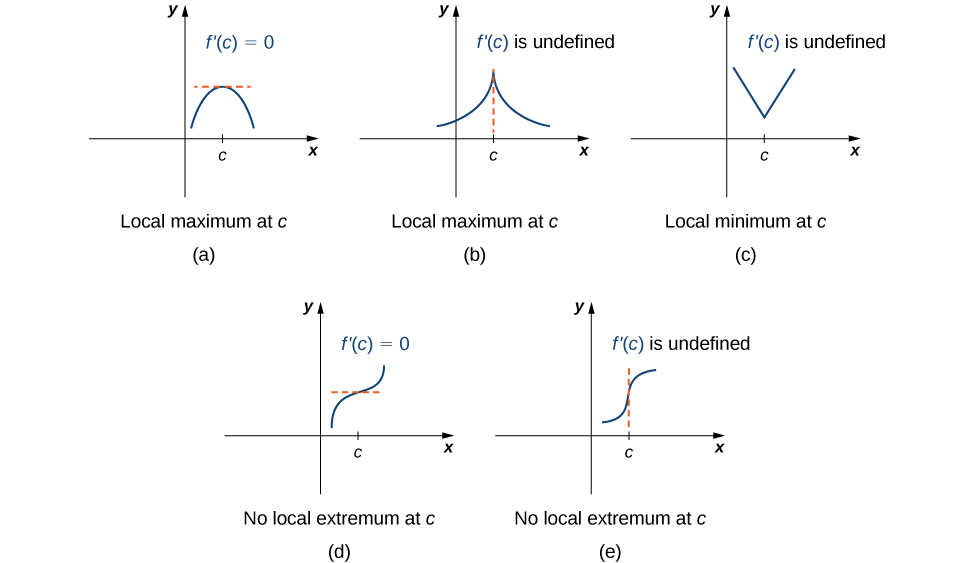
Note this theorem does not claim that a function must have a local extremum at a critical point. Rather, it states that critical points are candidates for local extrema. For example, consider the function We have when Therefore, is a critical point. However, is increasing over and thus does not have a local extremum at In Figure 4.15, we see several different possibilities for critical points. In some of these cases, the functions have local extrema at critical points, whereas in other cases the functions do not. Note that these graphs do not show all possibilities for the behavior of a function at a critical point.
英語のヒント
この定理は、関数が臨界点で必ず極値をとる、と主張しているわけではない。臨界点は、極値をとる位置の候補なのである。例えばを考える。でとなるので、は臨界点である。しかし、は全体で増加しているため、はで極値をとらない。図4.15には、臨界点での関数の振る舞いをいくつか示した。臨界点で極値をとる場合もあれば、とらない場合もある。なお、この図がすべての可能性を尽くしているわけではない。
OpenStax, Rice University; Calculus Volume 1. · CC BY-NC-SA 4.0
Figure 4.15図 4.15
(a–e) A function has a critical point at if or is undefined. A function may or may not have a local extremum at a critical point.
(a)〜(e):であるか、が定義されないとき、関数はに臨界点をもつ。臨界点で極値をとる場合も、とらない場合もある。
Later in this chapter we look at analytical methods for determining whether a function actually has a local extremum at a critical point. For now, let’s turn our attention to finding critical points. We will use graphical observations to determine whether a critical point is associated with a local extremum.
臨界点で実際に極値をとるかどうかを、計算で判定する方法は、この章の後半で学ぶ。まずは臨界点を求めることに集中し、極値があるかどうかはグラフを見て判断しよう。
Example 4.12例題 4.12
Locating Critical Points臨界点を求める
For each of the following functions, find all critical points. Use a graphing utility to determine whether the function has a local extremum at each of the critical points.
次の各関数について、すべての臨界点を求めよ。グラフ作成ツールを使い、それぞれの臨界点で関数が極値をとるかどうかを調べよ。
Solution解き方
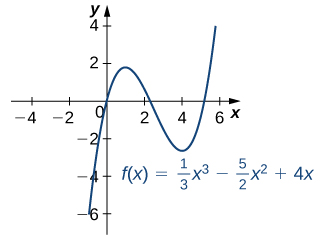
- The derivative is defined for all real numbers Therefore, we only need to find the values for where Since the critical points are and From the graph of in Figure 4.16, we see that has a local maximum at and a local minimum at導関数は、すべての実数で定義されている。したがって、を満たすだけを求めればよい。なので、臨界点はとである。図4.16ののグラフを見ると、はで極大値、で極小値をとる。
OpenStax, Rice University; Calculus Volume 1. · CC BY-NC-SA 4.0
Figure 4.16図 4.16This function has a local maximum and a local minimum.この関数には、極大値と極小値が一つずつある。 - Using the chain rule, we see the derivative is連鎖律を用いると、導関数は次のようになる。
Therefore, has critical points when and when We conclude that the critical points are From the graph of in Figure 4.17, we see that has a local (and absolute) minimum at but does not have a local extremum at orしたがって、の臨界点は、のとき、およびのときに生じる。よって、臨界点はである。図4.17ののグラフから、はで極小値をとり、それが最小値でもある。一方、とでは極値をとらない。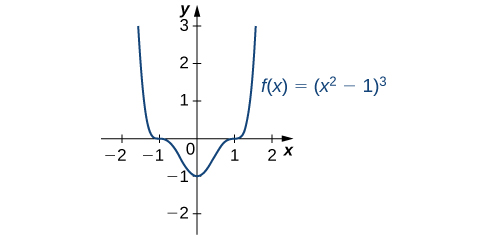
OpenStax, Rice University; Calculus Volume 1. · CC BY-NC-SA 4.0
Figure 4.17図 4.17This function has three critical points: and The function has a local (and absolute) minimum at but does not have extrema at the other two critical points.この関数の臨界点は、、、の三つである。で極小値をとり、それが最小値でもあるが、残る二つの臨界点では極値をとらない。 - By the quotient rule, we see that the derivative is商の微分法則から、導関数は次のようになる。
The derivative is defined everywhere. Therefore, we only need to find values for where Solving we see that which implies Therefore, the critical points are From the graph of in Figure 4.18, we see that has an absolute maximum at and an absolute minimum at Hence, has a local maximum at and a local minimum at (Note that if has an absolute extremum over an interval at a point that is not an endpoint of then has a local extremum at導関数はすべての実数で定義される。したがって、を満たすだけを求めればよい。を解くととなり、を得る。よって、臨界点はである。図4.18ののグラフから、はで最大値、で最小値をとる。したがって、はで極大値、で極小値もとる。なお、が区間上で、の端点ではない点において最大値または最小値をとるなら、はで極値もとる。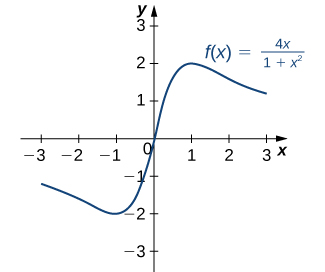
OpenStax, Rice University; Calculus Volume 1. · CC BY-NC-SA 4.0
Figure 4.18図 4.18This function has an absolute maximum and an absolute minimum.この関数には最大値と最小値がある。