第4章微分の応用
4.5 Derivatives and the Shape of a Graph4.5 導関数とグラフの形
Learning Objectives学習目標
- Explain how the sign of the first derivative affects the shape of a function’s graph.第1次導関数の符号とグラフの形の関係を説明できる。
- State the first derivative test for critical points.臨界点における第1次導関数の判定法を述べられる。
- Use concavity and inflection points to explain how the sign of the second derivative affects the shape of a function’s graph.凹凸と変曲点を用い、第2次導関数の符号とグラフの形の関係を説明できる。
- Explain the concavity test for a function over an open interval.開区間上の関数の凹凸を判定する方法を説明できる。
- Explain the relationship between a function and its first and second derivatives.関数と、その第1次・第2次導関数の関係を説明できる。
- State the second derivative test for local extrema.第2次導関数による極値の判定法を述べられる。
Earlier in this chapter we stated that if a function has a local extremum at a point then must be a critical point of However, a function is not guaranteed to have a local extremum at a critical point. For example, has a critical point at since is zero at but does not have a local extremum at Using the results from the previous section, we are now able to determine whether a critical point of a function actually corresponds to a local extreme value. In this section, we also see how the second derivative provides information about the shape of a graph by describing whether the graph of a function curves upward or curves downward.
英語のヒント
この章の前半で、関数が点で極値をとるなら、はの臨界点であると述べた。しかし、臨界点で必ず極値をとるとは限らない。例えば、はに臨界点をもつ。がで0になるからである。それでも、はで極値をとらない。前節の結果を使えば、臨界点が実際に極値をとる位置なのかを判定できる。また、この節では第2次導関数も使い、曲線がどちらに曲がるか、すなわちグラフの上に凸・下に凸という形を調べる。
The First Derivative Test第1次導関数による判定
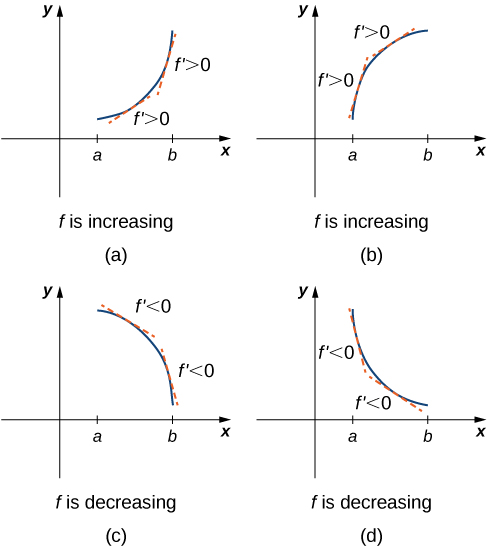
Corollary of the Mean Value Theorem showed that if the derivative of a function is positive over an interval then the function is increasing over On the other hand, if the derivative of the function is negative over an interval then the function is decreasing over as shown in the following figure.
平均値の定理の系では、区間上で導関数が正なら、関数は上で増加すると示した。一方、区間上で導関数が負なら、関数は上で減少する。次の図に示す。
OpenStax, Rice University; Calculus Volume 1. · CC BY-NC-SA 4.0
Figure 4.30図 4.30
Both functions are increasing over the interval At each point the derivative Both functions are decreasing over the interval At each point the derivative
(a)、(b)の二つの関数は区間上で増加し、各点でとなる。(c)、(d)の二つの関数は区間上で減少し、各点でとなる。
A continuous function has a local maximum at point if and only if switches from increasing to decreasing at point Similarly, has a local minimum at if and only if switches from decreasing to increasing at If is a continuous function over an interval containing and differentiable over except possibly at the only way can switch from increasing to decreasing (or vice versa) at point is if changes sign as increases through If is differentiable at the only way that can change sign as increases through is if Therefore, for a function that is continuous over an interval containing and differentiable over except possibly at the only way can switch from increasing to decreasing (or vice versa) is if or is undefined. Consequently, to locate local extrema for a function we look for points in the domain of such that or is undefined. Recall that such points are called critical points of
英語のヒント
まず、注目する点の左右で増減がそれぞれ一定となる場合を考える。連続関数が点で極大値をとるのは、が点で増加から減少に切り替わるときである。同様に、がで極小値をとるのは、がで減少から増加に切り替わるときである。がを含む区間上で連続であり、を除いて上で微分可能であるとする。が点で増加から減少へ、または減少から増加へ切り替わることは、がを左から右へ通過するとき、の符号が切り替わることに対応する。がで微分可能なら、がを通過するときにが符号を変えるには、でなければならない。したがって、を含む区間上で連続で、を除いて上で微分可能な関数について、の増減が切り替わる候補は、となる点、またはが定義されない点である。よって、関数の極値を探すには、の定義域内で、となるかが定義されない点を求める。このような点を、の臨界点と呼ぶのだった。
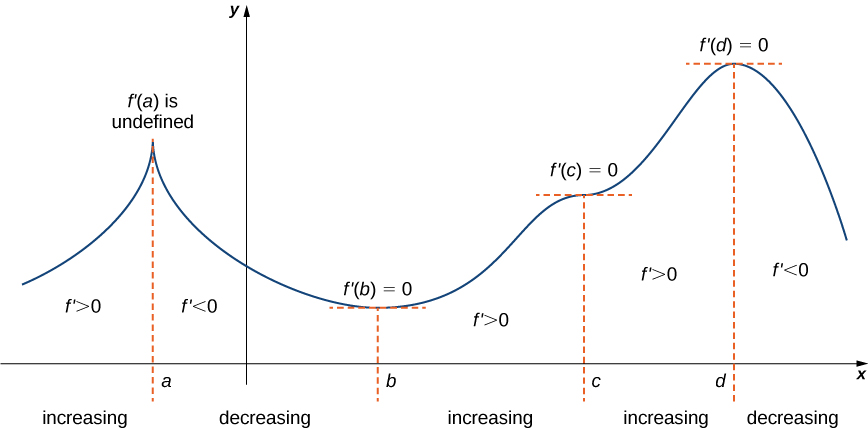
Note that need not have local extrema at a critical point. The critical points are candidates for local extrema only. In Figure 4.31, we show that if a continuous function has a local extremum, it must occur at a critical point, but a function may not have a local extremum at a critical point. We show that if has a local extremum at a critical point, then the sign of switches as increases through that point.
は、臨界点で必ず極値をとるわけではない。臨界点はあくまで候補である。図4.31では、連続関数の極値は臨界点で生じるが、臨界点のすべてが極値をとる位置ではないことが分かる。この図でが極値をとる各臨界点では、がその点を左から右に通過すると、の符号が切り替わっている。
OpenStax, Rice University; Calculus Volume 1. · CC BY-NC-SA 4.0
Figure 4.31図 4.31
The function has four critical points: The function has local maxima at and and a local minimum at The function does not have a local extremum at The sign of changes at all local extrema.
関数には四つの臨界点がある。はとで極大値、で極小値をとる。はでは極値をとらない。この図の極大・極小の位置では、いずれもの符号が切り替わる。
Using Figure 4.31, we summarize the main results regarding local extrema.
図4.31を使って、極大・極小の判定を整理しよう。
- If a continuous function has a local extremum, it must occur at a critical point連続関数が極値をとる位置は、必ず臨界点である。
- The function has a local extremum at the critical point if and only if the derivative switches sign as increases through左右の小区間で導関数の符号がそれぞれ一定で0でない場合、臨界点で極値をとるのは、がを通過するときにの符号が切り替わる場合である。
- Therefore, to test whether a function has a local extremum at a critical point we must determine the sign of to the left and right ofしたがって、臨界点で極値をとるかを判定するには、の左側と右側での符号を調べる。
This result is known as the first derivative test.
これを第1次導関数による判定と呼ぶ。
We can summarize the first derivative test as a strategy for locating local extrema.
第1次導関数による判定を、極値をとる位置を探す手順としてまとめよう。
Now let’s look at how to use this strategy to locate all local extrema for particular functions.
この手順で、具体的な関数の極値をとる位置をすべて求めよう。
Example 4.17例題 4.17
Using the First Derivative Test to Find Local Extrema第1次導関数を用いて極値を求める
Use the first derivative test to find the location of all local extrema for Use a graphing utility to confirm your results.
第1次導関数による判定を用い、が極値をとる位置をすべて求めよ。グラフ作成ツールで結果を確認せよ。
Solution解き方
Step 1. The derivative is To find the critical points, we need to find where Factoring the polynomial, we conclude that the critical points must satisfy
手順1:導関数はである。臨界点を求めるには、となる位置を探せばよい。因数分解すると、臨界点は次式を満たす。
Therefore, the critical points are Now divide the interval into the smaller intervals
したがって、臨界点はである。区間を、小区間に分ける。
Step 2. Since is a continuous function, to determine the sign of over each subinterval, it suffices to choose a point over each of the intervals and determine the sign of at each of these points. For example, let’s choose as test points.
英語のヒント
手順2:は連続なので、各小区間でのの符号を調べるには、のそれぞれから一点を選び、その点でのの符号を求めれば十分である。例えば、試験点としてを選ぼう。
Interval 区間 |
Test Point 調べる点 |
Sign of at Test Point 調べる点でのの符号 |
Conclusion 結論 |
|---|---|---|---|
is increasing. は増加している。 |
|||
is decreasing. は減少している。 |
|||
is increasing. は増加している。 |
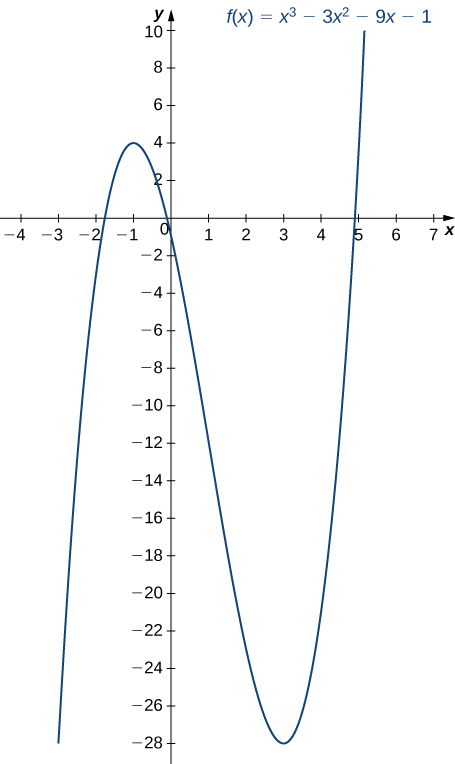
Step 3. Since switches sign from positive to negative as increases through has a local maximum at Since switches sign from negative to positive as increases through has a local minimum at These analytical results agree with the following graph.
手順3:がを左から右へ通過すると、の符号は正から負に変わる。したがって、fはで極大値をとる。同様に、がを通過すると、の符号は負から正に変わるため、fはで極小値をとる。計算による結果は、次のグラフとも一致する。
OpenStax, Rice University; Calculus Volume 1. · CC BY-NC-SA 4.0
Figure 4.32図 4.32
The function has a maximum at and a minimum at
関数はで極大値、で極小値をとる。
Example 4.18例題 4.18
Using the First Derivative Test第1次導関数による判定
Use the first derivative test to find the location of all local extrema for Use a graphing utility to confirm your results.
第1次導関数による判定を用い、が極値をとる位置をすべて求めよ。グラフ作成ツールで結果を確認せよ。
Solution解き方
Step 1. The derivative is
手順1:導関数は、
The derivative when Therefore, at The derivative is undefined at Therefore, we have three critical points: and Consequently, divide the interval into the smaller intervals and
のとき、導関数はとなる。よって、でである。また、はで定義されない。したがって、臨界点は、、の三つである。区間を、小区間、に分ける。
Step 2: Since is continuous over each subinterval, it suffices to choose a test point in each of the intervals from step and determine the sign of at each of these points. The points are test points for these intervals.
手順2:は各小区間で連続なので、手順で得た各区間から試験点を一つ選び、その点のの符号を求めればよい。ここでは、各区間の試験点としてを選ぶ。
Interval 区間 |
Test Point 調べる点 |
Sign of at Test Point 調べる点でのの符号 |
Conclusion 結論 |
|---|---|---|---|
is decreasing. は減少している。 |
|||
is increasing. は増加している。 |
|||
is increasing. は増加している。 |
|||
is decreasing. は減少している。 |
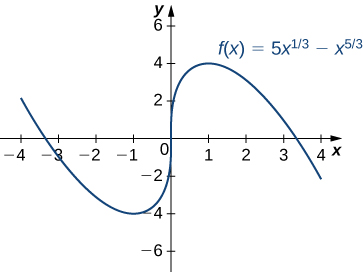
Step 3: Since is decreasing over the interval and increasing over the interval has a local minimum at Since is increasing over the interval and the interval does not have a local extremum at Since is increasing over the interval and decreasing over the interval has a local maximum at The analytical results agree with the following graph.
手順3:は区間で減少し、区間で増加する。したがって、はで極小値をとる。は区間との両方で増加するため、はで極値をとらない。は区間で増加し、区間で減少する。よって、fはで極大値をとる。これらの計算結果は次のグラフとも一致する。
OpenStax, Rice University; Calculus Volume 1. · CC BY-NC-SA 4.0
Figure 4.33図 4.33
The function f has a local minimum at and a local maximum at
関数fはで極小値、で極大値をとる。