第28章銀河の進化と分布The Evolution and Distribution of Galaxies
Superclusters and Voids超銀河団とボイド
After astronomers discovered clusters of galaxies, they naturally wondered whether there were still larger structures in the universe. Do clusters of galaxies gather together? To answer this question, we must be able to map large parts of the universe in three dimensions. We must know not only the position of each galaxy on the sky (that’s two dimensions) but also its distance from us (the third dimension).
英語のヒント
銀河団を発見すると、天文学者は自然に、宇宙にはさらに大きな構造があるのかと考えた。銀河団も、集まっているのだろうか。この問いに答えるには、宇宙の広い範囲を三次元で地図にしなければならない。各銀河の空での位置という二つの次元だけでなく、私たちからの距離という第三の次元も、知る必要がある。
This means we must be able to measure the redshift of each galaxy in our map. Taking a spectrum of each individual galaxy to do this is a much more time-consuming task than simply counting galaxies seen in different directions on the sky, as Hubble did. Today, astronomers have found ways to get the spectra of many galaxies in the same field of view (sometimes hundreds or even thousands at a time) to cut down the time it takes to finish their three-dimensional maps. Larger telescopes are also able to measure the redshifts—and therefore the distances—of much more distant galaxies and (again) to do so much more quickly than previously possible.
英語のヒント
そのためには、地図に載せる銀河の一つ一つについて、赤方偏移を測定する必要がある。個々の銀河のスペクトルを得る作業は、ハッブルのように、空のいろいろな方向に見える銀河を数えるだけより、はるかに時間がかかる。現在、天文学者は、同じ視野内の多数の銀河について、時には数百から数千のスペクトルを一度に得る方法を見いだし、三次元地図の完成にかかる時間を短くしている。さらに、大型望遠鏡では、より遠い銀河の赤方偏移、したがって距離も測定でき、これも以前よりはるかに短時間で行える。
Another challenge astronomers faced in deciding how to go about constructing a map of the universe is similar to that confronted by the first team of explorers in a huge, uncharted territory on Earth. Since there is only one band of explorers and an enormous amount of land, they have to make choices about where to go first. One strategy might be to strike out in a straight line in order to get a sense of the terrain. They might, for example, cross some mostly empty prairies and then hit a dense forest. As they make their way through the forest, they learn how thick it is in the direction they are traveling, but not its width to their left or right. Then a river crosses their path; as they wade across, they can measure its width but learn nothing about its length. Still, as they go on in their straight line, they begin to get some sense of what the landscape is like and can make at least part of a map. Other explorers, striking out in other directions, will someday help fill in the remaining parts of that map.
英語のヒント
宇宙の地図づくりをどう進めるか決める際、天文学者が直面するもう一つの問題は、地球の巨大な未踏の土地に初めて入る探検隊の問題に似ている。探検隊は一組しかなく、土地は途方もなく広いので、最初にどこへ行くかを選ばなければならない。一つの戦略は、一直線に進み、地形の感じをつかむことだろう。例えば、ほぼ何もない大草原を横切った後、密な森にぶつかるかもしれない。森を抜けていくと、進行方向の厚みはわかるが、左右への広がりはわからない。その後、川が行く手を横切る。歩いて渡れば川幅は測れるが、長さはわからない。それでも直進を続けるうち、地形のありさまを少しずつつかみ、地図の少なくとも一部を作れる。別の方向へ出発した他の探検隊が、いつか、その地図の残りを埋める助けになるだろう。
Astronomers have traditionally had to make the same sort of choices. We cannot explore the universe in every direction to infinite “depth” or sensitivity: there are far too many galaxies and far too few telescopes to do the job. But we can pick a single direction or a small slice of the sky and start mapping the galaxies. Margaret Geller, the late John Huchra, and their students at the Harvard-Smithsonian Center for Astrophysics pioneered this technique, and several other groups have extended their work to cover larger volumes of space.
英語のヒント
天文学者も、従来、同じような選択を迫られてきた。どの方向にも無限の「深さ」、つまり無限の感度で宇宙を調べることはできない。銀河はあまりに多く、その作業をする望遠鏡はあまりに少ないからである。しかし、一つの方向、あるいは空の薄い切片を選び、銀河の地図を作り始めることはできる。ハーバード・スミソニアン天体物理学センターのマーガレット・ゲラー、故ジョン・ハクラとその学生たちは、この方法を切り開いた。その後、他の研究グループも研究を発展させ、より広い宇宙空間を調べてきた。
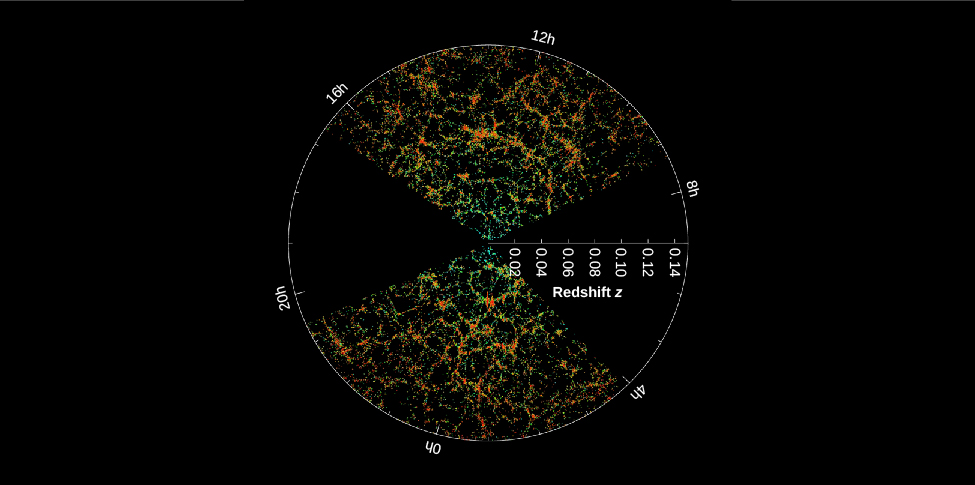
The largest universe mapping project to date is the Sloan Digital Sky Survey (see the Making Connections feature box Astronomy and Technology: The Sloan Digital Sky Survey at the end of this section). A plot of the distribution of galaxies mapped by the Sloan survey is shown in Figure 28.21. To the surprise of astronomers, maps like the one in the figure showed that clusters of galaxies are not arranged uniformly throughout the universe, but are found in huge filamentary superclusters that look like great arcs of inkblots splattered across a page. The Local Group is part of a supercluster we call the Virgo Supercluster because it also includes the giant Virgo cluster of galaxies. The superclusters resemble an irregularly torn sheet of paper or a pancake in shape—they can extend for hundreds of millions of light-years in two dimensions, but are only 10 to 20 million light-years thick in the third dimension. Detailed study of some of these structures shows that their masses are a few times 1016 MSun, which is 10,000 times more massive than the Milky Way Galaxy.
英語のヒント
これまでで最大の宇宙地図づくりの計画は、スローン・デジタル・スカイ・サーベイである。この節の終わりの「つながりを考える:天文学と技術――スローン・デジタル・スカイ・サーベイ」を参照しよう。図28.21には、この調査で地図にされた銀河の分布を示す。天文学者が驚いたことに、こうした地図では、銀河団は宇宙全体に一様に配置されていない。紙の上に飛び散ったインクの大きな弧のように見える、巨大な糸状の超銀河団を作っている。局所銀河群は、おとめ座超銀河団の一部である。巨大なおとめ座銀河団も含むため、この名前で呼ばれる。超銀河団の形は、不規則に破れた紙やパンケーキに似ている。二つの方向には数億光年も広がるが、第三の方向の厚みは1000万〜2000万光年しかない。一部を詳しく調べると、質量は数 × 1016 MSunで、天の川銀河の1万倍ほどもあることがわかる。
Sloan Digital Sky Survey Map of the Large-Scale Structure of the Universe.スローン・デジタル・スカイ・サーベイによる宇宙の大規模構造の地図
credit: modification of work by M. Blanton and the Sloan Digital Sky Survey · CC BY
Figure 28.21 This image shows slices from the SDSS map. The point at the center corresponds to the Milky Way and might say “You Are Here!” Points on the map moving outward from the center are farther away. The distance to the galaxies is indicated by their redshifts (following Hubble’s law), shown on the horizontal line going right from the center. The redshift z = Δλ/λ, where Δλ is the difference between the observed wavelength and the wavelength λ emitted by a nonmoving source in the laboratory. Right ascension on the sky is shown around the circumference of the circular graph. The colors of the galaxies indicate the ages of their stars, with the redder color showing galaxies that are made of older stars. The outer circle is at a distance of two billion light-years from us. Note that red (older stars) galaxies are more strongly clustered than blue galaxies (young stars). The unmapped areas are where our view of the universe is obstructed by dust in our own Galaxy. (credit: modification of work by M. Blanton and the Sloan Digital Sky Survey)
図28.21 スローン・デジタル・スカイ・サーベイの地図から、切片を示した画像。中央の点が天の川銀河で、「現在地」と書いてもよいだろう。地図上の点は、中心から外へ行くほど遠くにある。銀河までの距離は、ハッブルの法則に従って、赤方偏移で示される。その目盛りは、中心から右へ伸びる水平線にある。赤方偏移はz = Δλ/λであり、Δλは、観測波長と、実験室で静止した光源が放出する波長λとの差である。円グラフの外周には、空の赤経が示されている。銀河の色は恒星の年齢を表し、赤いほど古い恒星からなる銀河である。外側の円は、私たちから20億光年の距離に当たる。赤い銀河、つまり古い星を持つ銀河は、青い、若い星を持つ銀河より、強く集まっていることに注目しよう。地図のない部分は、天の川銀河の塵が視界を遮っている方向である。(クレジット:M. BlantonとSloan Digital Sky Surveyによる作品を改変)
Separating the filaments and sheets in a supercluster are voids, which look like huge empty bubbles walled in by the great arcs of galaxies. They have typical diameters of 150 million light-years, with the clusters of galaxies concentrated along their walls. The whole arrangement of filaments and voids reminds us of a sponge, the inside of a honeycomb, or a hunk of Swiss cheese with very large holes. If you take a good slice or cross-section through any of these, you will see something that looks roughly like Figure 28.21.
英語のヒント
超銀河団のフィラメントやシートを隔てるのは、ボイドと呼ばれる領域である。銀河の大きな弧を壁として囲まれた、巨大で空っぽの泡のように見える。典型的な直径は1億5000万光年で、銀河団はその壁に沿って集まっている。フィラメントとボイドの全体的な配置は、スポンジ、蜂の巣の内部、あるいは大穴の開いたスイスチーズの塊を思わせる。これらのどれかをうまく薄切りにして断面を取ると、図28.21と大まかに似たものが見えるだろう。
Before these voids were discovered, most astronomers would probably have predicted that the regions between giant clusters of galaxies were filled with many small groups of galaxies, or even with isolated individual galaxies. Careful searches within these voids have found few galaxies of any kind. Apparently, 90 percent of the galaxies occupy less than 10 percent of the volume of space.
英語のヒント
ボイドが発見される前なら、多くの天文学者は、巨大銀河団の間の領域には、小さな銀河群や、孤立した個々の銀河が多数満ちていると予想しただろう。しかし、ボイド内部を丁寧に探しても、どの種類の銀河も、ごくわずかしか見つからなかった。どうやら、銀河の90%が、宇宙空間の体積の10%未満を占めているらしい。
Galaxy Distribution銀河の分布
To determine the distribution of galaxies in three-dimensional space, astronomers have to measure their positions and their redshifts. The larger the volume of space surveyed, the more likely the measurement is a fair sample of the universe as a whole. However, the work involved increases very rapidly as you increase the volume covered by the survey.
英語のヒント
三次元空間での銀河の分布を求めるには、銀河の位置と赤方偏移を測定しなければならない。調査する空間の体積が大きいほど、その測定は宇宙全体を偏りなく代表する標本になりやすい。しかし、調査が覆う体積を増やすと、必要な作業は急速に増える。
Let’s do a quick calculation to see why this is so.
なぜそうなるか、簡単に計算してみよう。
Suppose that you have completed a survey of all the galaxies within 30 million light-years and you now want to survey to 60 million light-years. What volume of space is covered by your second survey? How much larger is this volume than the volume of your first survey? Remember that the volume of a sphere, V, is given by the formula V = 4/3πR3, where R is the radius of the sphere.
3000万光年以内のすべての銀河の調査を終え、今度は6000万光年まで調べたいとしよう。二回目の調査が覆う空間の体積はいくらか。それは、最初の調査の体積の何倍になるか。球の体積Vは、V = (4/3)πR3で与えられることを思い出そう。Rは球の半径である。
Solution解き方
Since the volume of a sphere depends on R3 and the second survey reaches twice as far in distance, it will cover a volume that is times larger. The total volume covered by the second survey will be .
球の体積はR3に比例し、二回目の調査は距離で2倍先まで届く。したがって、覆う体積は倍になる。二回目の調査が覆う全体積はである。
Check Your Learning理解を確かめよう
Suppose you now want to expand your survey to 90 million light-years. What volume of space is covered, and how much larger is it than the volume of the second survey?
今度は調査を9000万光年まで広げたいとしよう。覆う空間の体積はいくらになり、それは二回目の調査の体積の何倍か。
In the past few years, even larger, more sensitive telescopes have begun operation. The 6.5-meter James Webb Space Telescope (JWST) was launched in late 2021 and is now in regular operation. One of the major goals of this telescope is to observe directly the light of the first galaxies and even the first stars to shine. The most distant galaxy observed with it, as of this writing, was already formed a mere 330 million years after the Big Bang. The Atacama Large Millimeter Array (ALMA) in Chile has detected far-infrared and millimeter-wave radiation from massive star-bursting galaxies and has also measured redshifts that show that these galaxies were already in existence only a few hundred million years after the expansion of the universe began. (Note these young galaxies are being detected at infrared and millimeter wavelengths because their high redshifts shift the electromagnetic radiation that they emit to very long wavelengths.)
英語のヒント
ここ数年で、さらに大きく高感度の望遠鏡が稼働し始めた。口径6.5 mのジェイムズ・ウェッブ宇宙望遠鏡JWSTは、2021年末に打ち上げられ、現在は通常運用を行っている。主要な目標の一つは、最初の銀河、さらには最初に輝いた恒星の光を、直接観測することである。執筆時点で、JWSTが観測した最遠方の銀河は、ビッグバンからわずか3億3000万年後に、すでに形成されていた。チリのアタカマ大型ミリ波サブミリ波干渉計ALMAは、大質量のスターバースト銀河から遠赤外線やミリ波を検出し、赤方偏移も測定した。その結果、これらの銀河は、宇宙の膨張開始からわずか数億年後には、すでに存在していたとわかる。このような若い銀河を赤外線やミリ波で検出するのは、大きな赤方偏移によって、放出された電磁放射が非常に長い波長へ移るためである。
Astronomers were initially surprised to find that galaxies could form so quickly, and they are now exploring new models that incorporate ordinary matter, dark matter with various properties, and even massive primordial black holes that formed soon after the Big Bang, to explain the rapid, early formation of galaxies.
英語のヒント
銀河がこれほどすばやく形成できるとは、天文学者も当初は驚いた。現在は、この急速な初期の銀河形成を説明するため、通常の物質、さまざまな性質のダークマター、さらにはビッグバン直後に形成された大質量の原始ブラックホールまで組み込んだ、新しいモデルを検討している。
At this point, if you have been thinking about our discussions of the expanding universe in Galaxies, you may be wondering what exactly in Figure 28.21 is expanding. We know that the galaxies and clusters of galaxies are held together by their gravity and do not expand as the universe does. However, the voids do grow larger and the filaments move farther apart as space stretches (see The Big Bang).
英語のヒント
ここまで読んで、「銀河」で扱った宇宙膨張について考えていた人は、図28.21の、いったい何が膨張しているのか気になるかもしれない。銀河や銀河団は自身の重力で結び付けられており、宇宙全体のようには膨張しない。しかし、空間が伸びるにつれて、ボイドは確かに大きくなり、フィラメント同士の間隔は広がる。「ビッグバン」を参照しよう。