第9章独占
Illustrating Monopoly Profits独占利潤を図で示す
It is straightforward to calculate profits of given numbers for total revenue and total cost. However, the size of monopoly profits can also be illustrated graphically with Figure 9.6, which takes the marginal cost and marginal revenue curves from the previous exhibit and adds an average cost curve and the monopolist’s perceived demand curve. Table 9.5 shows the data for these curves.
英語のヒント
Quantity Q 数量Q |
Demand P 需要P |
Marginal Revenue MR 限界収入MR |
Marginal Cost MC 限界費用MC |
Average Cost AC 平均費用AC |
|---|---|---|---|---|
1 |
1,200 |
1,200 |
500 |
500 |
2 |
1,100 |
1,000 |
275 |
388 |
3 |
1,000 |
800 |
225 |
333 |
4 |
900 |
600 |
250 |
313 |
5 |
800 |
400 |
400 |
330 |
6 |
700 |
200 |
850 |
417 |
7 |
600 |
0 |
1,500 |
571 |
8 |
500 |
–200 |
2,400 |
800 |
Illustrating Profits at the HealthPill Monopoly独占企業ヘルスピルの利潤を図で示す
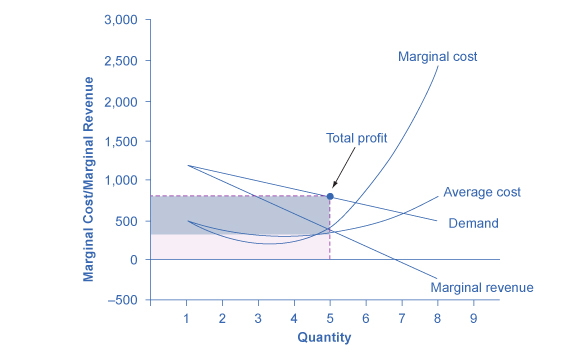
Figure 9.6図 9.6
This figure begins with the same marginal revenue and marginal cost curves from the HealthPill monopoly from Figure 9.5. It then adds an average cost curve and the demand curve that the monopolist faces. The HealthPill firm first chooses the quantity where MR = MC. In this example, the quantity is 5. The monopolist then decides what price to charge by looking at the demand curve it faces. The large box, with quantity on the horizontal axis and demand (which shows the price) on the vertical axis, shows total revenue for the firm. The lighter-shaded box, which is quantity on the horizontal axis and average cost of production on the vertical axis shows the firm's total costs. The large total revenue box minus the smaller total cost box leaves the darkly shaded box that shows total profits. Since the price charged is above average cost, the firm is earning positive profits.
英語のヒント
この図は、図9.5と同じ独占企業ヘルスピルの限界収入曲線と限界費用曲線から始まり、平均費用曲線と独占企業が直面する需要曲線を加えている。ヘルスピルはまずMR=MCとなる数量を選ぶ。この例では数量は5である。次に、直面する需要曲線を見て請求価格を決める。横軸に数量、縦軸に需要(価格を示す)を取った大きな長方形が、企業の総収入を示す。横軸に数量、縦軸に生産の平均費用を取った薄い陰の長方形が、総費用を示す。大きな総収入の長方形から、小さな総費用の長方形を引くと、総利潤を示す濃い陰の長方形が残る。請求価格が平均費用を上回るので、企業は正の利潤を得ている。
Figure 9.7 illustrates the three-step process where a monopolist: selects the profit-maximizing quantity to produce; decides what price to charge; determines total revenue, total cost, and profit.
英語のヒント
図9.7は、独占企業が利潤を最大化する生産数量を選び、請求価格を決め、総収入・総費用・利潤を求める3段階の過程を示す。
Step 1: The Monopolist Determines Its Profit-Maximizing Level of Output
英語のヒント
手順1:独占企業が利潤を最大化する生産水準を決める
The firm can use the points on the demand curve D to calculate total revenue, and then, based on total revenue, calculate its marginal revenue curve. The profit-maximizing quantity will occur where MR = MC—or at the last possible point before marginal costs start exceeding marginal revenue. On Figure 9.6, MR = MC occurs at an output of 5.
英語のヒント
企業は需要曲線D上の点を用いて総収入を計算し、次にその総収入に基づいて限界収入曲線を計算できる。利潤を最大化する数量はMR=MCの点、または限界費用が限界収入を上回り始める直前の、最後に選べる点で生じる。図9.6では、生産量5でMR=MCとなる。
Step 2: The Monopolist Decides What Price to Charge
英語のヒント
手順2:独占企業が請求価格を決める
The monopolist will charge what the market is willing to pay. A dotted line drawn straight up from the profit-maximizing quantity to the demand curve shows the profit-maximizing price which, in Figure 9.6, is $800. This price is above the average cost curve, which shows that the firm is earning profits.
英語のヒント
独占企業は、市場が支払う意思のある価格を請求する。利潤を最大化する数量から需要曲線まで真上に引いた点線が、利潤を最大化する価格を示す。図9.6では800ドルである。この価格は平均費用曲線より上にあり、企業が利潤を得ていることを示す。
Step 3: Calculate Total Revenue, Total Cost, and Profit
英語のヒント
手順3:総収入、総費用、利潤を計算する
Total revenue is the overall shaded box, where the width of the box is the quantity sold and the height is the price. In Figure 9.6, this is 5 x $800 = $4000. In Figure 9.6, the bottom part of the shaded box, which is shaded more lightly, shows total costs; that is, quantity on the horizontal axis multiplied by average cost on the vertical axis or 5 x $330 = $1650. The larger box of total revenues minus the smaller box of total costs will equal profits, which the darkly shaded box shows. Using the numbers gives $4000 - $1650 = $2350. In a perfectly competitive market, the forces of entry would erode this profit in the long run. However, a monopolist is protected by barriers to entry. In fact, one obvious sign of a possible monopoly is when a firm earns profits year after year, while doing more or less the same thing, without ever seeing increased competition eroding those profits.
英語のヒント
総収入は陰を付けた長方形全体であり、幅は販売数量、高さは価格である。図9.6では、5×800ドル=4,000ドルとなる。図9.6で薄い陰が付いた長方形の下部は総費用を示す。つまり、横軸の数量と縦軸の平均費用を掛けた5×330ドル=1,650ドルである。大きな総収入の長方形から小さな総費用の長方形を引いたものが利潤であり、濃い陰の長方形で示される。数値で計算すると、4,000ドル-1,650ドル=2,350ドルである。完全競争市場では、長期には参入の力がこの利潤を侵食する。しかし独占企業は参入障壁に守られている。実際、ほぼ同じことをしながら、競争の増大によって利潤が侵食されることなく、毎年利潤を得る企業は、独占の可能性を示す明らかな徴候の一つである。
How a Profit-Maximizing Monopoly Decides Price利潤を最大化する独占企業は価格をどう決めるか
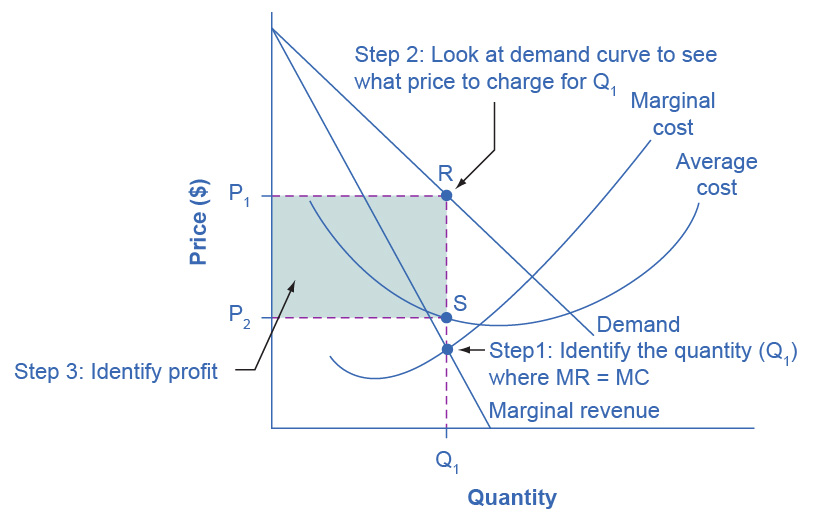


Figure 9.7図 9.7
In Step 1, the monopoly chooses the profit-maximizing level of output Q1, by choosing the quantity where MR = MC. In Step 2, the monopoly decides how much to charge for output level Q1 by drawing a line straight up from Q1 to point R on its perceived demand curve. Thus, the monopoly will charge a price (P1). In Step 3, the monopoly identifies its profit. Total revenue will be Q1 multiplied by P1. Total cost will be Q1 multiplied by the average cost of producing Q1, which point S shows on the average cost curve to be P2. Profits will be the total revenue rectangle minus the total cost rectangle, which the shaded zone in the figure shows.
英語のヒント
手順1では、独占企業はMR=MCとなる数量を選ぶことで、利潤を最大化する生産水準Q1を選ぶ。手順2では、Q1から認識される需要曲線上のR点まで真上に線を引き、生産水準Q1に対していくら請求するかを決める。したがって、独占企業は価格P1を請求する。手順3では利潤を特定する。総収入はQ1とP1の積になる。総費用は、Q1に、Q1を生産する平均費用を掛けたものになる。その平均費用は平均費用曲線上のS点でP2と示される。利潤は総収入の長方形から総費用の長方形を引いたもので、図の陰の部分が示している。