第9章独占
Total Cost and Total Revenue for a Monopolist独占企業の総費用と総収入
We can illustrate profits for a monopolist with a graph of total revenues and total costs, with the example of the hypothetical HealthPill firm in Figure 9.4. The total cost curve has its typical shape that we learned about in Production, Costs and Industry Structure, and that we used in Perfect Competition; that is, total costs rise and the curve grows steeper as output increases, as the final column of Table 9.2 shows.
英語のヒント
図9.4の架空のヘルスピル社の例を使い、総収入と総費用のグラフで独占企業の利潤を示すことができる。総費用曲線は、「生産、費用、産業構造」で学び、「完全競争」で使った典型的な形をしている。つまり、表9.2の最終列が示すように、生産量が増すと総費用が増え、曲線の傾きが急になる。
Total Revenue and Total Cost for the HealthPill Monopoly独占企業ヘルスピルの総収入と総費用
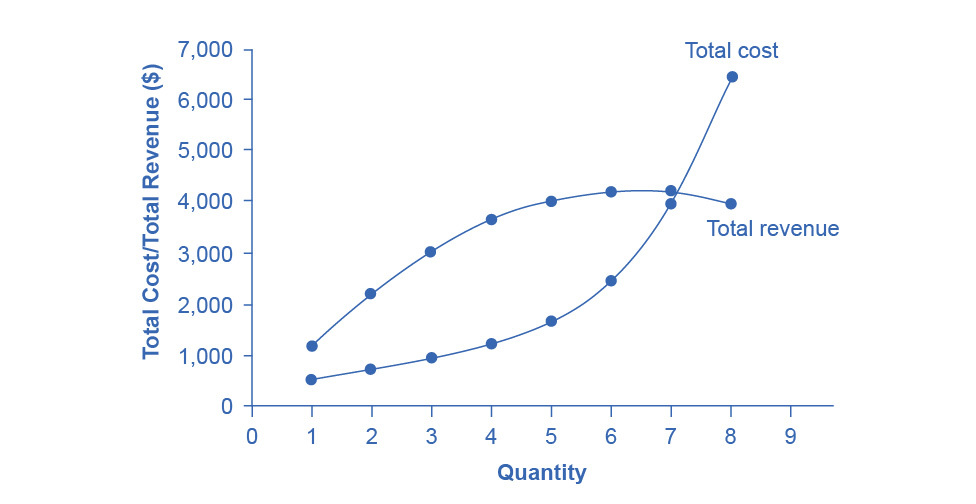
Figure 9.4図 9.4
Total revenue for the monopoly firm called HealthPill first rises, then falls. Low levels of output bring in relatively little total revenue, because the quantity is low. High levels of output bring in relatively less revenue, because the high quantity pushes down the market price. The total cost curve is upward-sloping. Profits will be highest at the quantity of output where total revenue is most above total cost. The profit-maximizing level of output is not the same as the revenue-maximizing level of output, which should make sense, because profits take costs into account and revenues do not.
英語のヒント
ヘルスピルという独占企業の総収入は、初め増え、次に減る。生産量が少ないと、数量が少ないため総収入は比較的小さい。生産量が多いと、その多さが市場価格を押し下げるため、収入は比較的少なくなる。総費用曲線は右上がりである。総収入が総費用を最も大きく上回る生産量で、利潤が最大になる。利潤を最大化する生産水準は、収入を最大化する生産水準と同じではない。利潤は費用を考慮するが収入は考慮しないので、これは道理にかなう。
Quantity Q 数量Q |
Price P 価格P |
Total Revenue TR 総収入TR |
Total Cost TC 総費用TC |
|---|---|---|---|
1 |
1,200 |
1,200 |
500 |
2 |
1,100 |
2,200 |
750 |
3 |
1,000 |
3,000 |
1,000 |
4 |
900 |
3,600 |
1,250 |
5 |
800 |
4,000 |
1,650 |
6 |
700 |
4,200 |
2,500 |
7 |
600 |
4,200 |
4,000 |
8 |
500 |
4,000 |
6,400 |
Total revenue, though, is different. Since a monopolist faces a downward sloping demand curve, the only way it can sell more output is by reducing its price. Selling more output raises revenue, but lowering price reduces it. Thus, the shape of total revenue isn’t clear. Let’s explore this using the data in Table 9.2, which shows quantities along the demand curve and the price at each quantity demanded, and then calculates total revenue by multiplying price times quantity at each level of output. (In this example, we give the output as 1, 2, 3, 4, and so on, for the sake of simplicity. If you prefer a dash of greater realism, you can imagine that the pharmaceutical company measures these output levels and the corresponding prices per 1,000 or 10,000 pills.) As the figure illustrates, total revenue for a monopolist has the shape of a hill, first rising, next flattening out, and then falling. In this example, total revenue is highest at a quantity of 6 or 7.
英語のヒント
しかし総収入は異なる。独占企業は右下がりの需要曲線に直面するため、より多く売る唯一の方法は値下げである。販売量の増加は収入を増やすが、値下げは収入を減らす。したがって、総収入の形は明らかではない。表9.2のデータで探ってみよう。この表は需要曲線上の数量と、各需要量での価格を示し、それぞれの生産水準で価格と数量を掛けて総収入を計算している。(この例では簡単のため、生産量を1、2、3、4などとしている。少し現実味を加えたければ、製薬会社が錠剤1,000錠または10,000錠を単位として生産水準と対応する価格を測っていると考えてもよい。)図のように、独占企業の総収入は丘の形をしており、初めは上昇し、次に平らになり、その後下がる。この例では、数量6または7で総収入が最大になる。
However, the monopolist is not seeking to maximize revenue, but instead to earn the highest possible profit. In the HealthPill example in Figure 9.4, the highest profit will occur at the quantity where total revenue is the farthest above total cost. This looks to be somewhere in the middle of the graph, but where exactly? It is easier to see the profit maximizing level of output by using the marginal approach, to which we turn next.
英語のヒント
しかし独占企業が求めているのは、収入の最大化ではなく、可能なかぎり高い利潤である。図9.4のヘルスピルの例では、総収入が総費用を最も大きく上回る数量で、最大の利潤が生じる。これはグラフの中央付近に見えるが、正確にはどこだろうか。次に扱う限界的な分析を使うと、利潤を最大化する生産水準をより簡単に見いだせる。
Marginal Revenue and Marginal Cost for a Monopolist独占企業の限界収入と限界費用
In the real world, a monopolist often does not have enough information to analyze its entire total revenues or total costs curves. After all, the firm does not know exactly what would happen if it were to alter production dramatically. However, a monopolist often has fairly reliable information about how changing output by small or moderate amounts will affect its marginal revenues and marginal costs, because it has had experience with such changes over time and because modest changes are easier to extrapolate from current experience. A monopolist can use information on marginal revenue and marginal cost to seek out the profit-maximizing combination of quantity and price.
英語のヒント
現実の世界では、独占企業は総収入曲線や総費用曲線の全体を分析するのに十分な情報を持たないことが多い。生産を大幅に変えたら何が起こるかを、企業は正確には知らないからである。しかし、生産量を小幅または中程度に変えると限界収入と限界費用がどう変わるかについては、独占企業はかなり信頼できる情報を持つことが多い。過去にそのような変化を経験しており、穏やかな変化なら現在の経験から推測しやすいからである。独占企業は、限界収入と限界費用の情報を使い、利潤を最大化する数量と価格の組み合わせを探すことができる。
Table 9.3 expands Table 9.2 using the figures on total costs and total revenues from the HealthPill example to calculate marginal revenue and marginal cost. This monopoly faces typical upward-sloping marginal cost and downward-sloping marginal revenue curves, as Figure 9.5 shows.
英語のヒント
Notice that marginal revenue is zero at a quantity of 7, and turns negative at quantities higher than 7. It may seem counterintuitive that marginal revenue could ever be zero or negative: after all, doesn't an increase in quantity sold not always mean more revenue? For a perfect competitor, each additional unit sold brought a positive marginal revenue, because marginal revenue was equal to the given market price. However, a monopolist can sell a larger quantity and see a decline in total revenue. When a monopolist increases sales by one unit, it gains some marginal revenue from selling that extra unit, but also loses some marginal revenue because it must now sell every other unit at a lower price. As the quantity sold becomes higher, at some point the drop in price is proportionally more than the increase in greater quantity of sales, causing a situation where more sales bring in less revenue. In other words, marginal revenue is negative.
英語のヒント
数量7で限界収入がゼロになり、7を超えると負になる点に注目しよう。限界収入がゼロや負になることは直感に反するかもしれない。販売量の増加は、いつでも収入の増加を意味するのではないのだろうか。完全競争企業では、限界収入が与えられた市場価格に等しいため、追加で売る各単位は正の限界収入をもたらした。しかし独占企業では、販売量を増やしても総収入が減ることがある。独占企業が販売量を1単位増やすと、その追加単位の販売から限界収入を得るが、他のすべての単位もより低い価格で売らなければならず、そのため限界収入を一部失う。販売量が増えていくと、ある時点で価格の下落率が販売数量の増加率を上回り、販売量が多いほど収入が少ない状況になる。言い換えれば、限界収入が負になる。
Marginal Revenue and Marginal Cost for the HealthPill Monopoly独占企業ヘルスピルの限界収入と限界費用
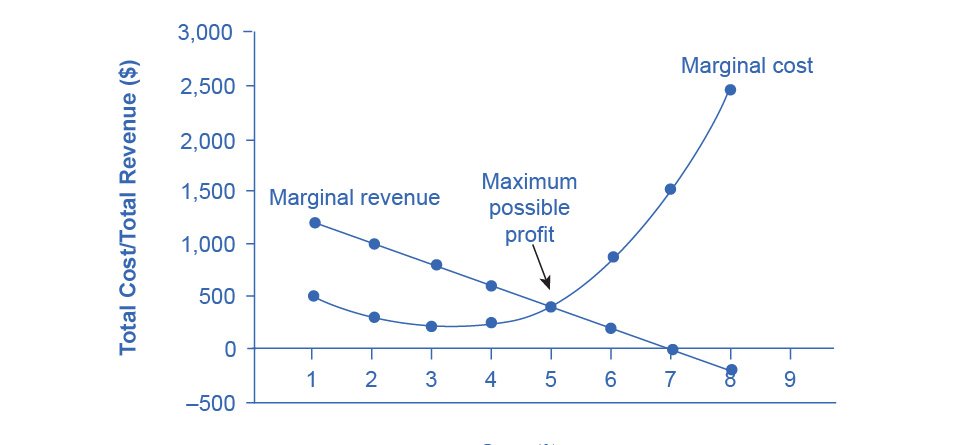


Figure 9.5図 9.5
For a monopoly like HealthPill, marginal revenue decreases as it sells additional units of output. The marginal cost curve is upward-sloping. The profit-maximizing choice for the monopoly will be to produce at the quantity where marginal revenue is equal to marginal cost: that is, MR = MC. If the monopoly produces a lower quantity, then MR > MC at those levels of output, and the firm can make higher profits by expanding output. If the firm produces at a greater quantity, then MC > MR, and the firm can make higher profits by reducing its quantity of output.
英語のヒント
ヘルスピルのような独占企業では、追加的な生産物を売るにつれて限界収入が低下する。限界費用曲線は右上がりである。独占企業の利潤を最大化する選択は、限界収入が限界費用と等しい数量、すなわちMR=MCで生産することである。それより少量を生産すると、その生産水準ではMR>MCであり、増産すれば利潤を増やせる。より多量を生産するとMC>MRとなり、減産すれば利潤を増やせる。
Quantity Q 数量Q |
Total Revenue TR 総収入TR |
Marginal Revenue MR 限界収入MR |
Total Cost TC 総費用TC |
Marginal Cost MC 限界費用MC |
|---|---|---|---|---|
1 |
1,200 |
1,200 |
500 |
500 |
2 |
2,200 |
1,000 |
775 |
275 |
3 |
3,000 |
800 |
1,000 |
225 |
4 |
3,600 |
600 |
1,250 |
250 |
5 |
4,000 |
400 |
1,650 |
400 |
6 |
4,200 |
200 |
2,500 |
850 |
7 |
4,200 |
0 |
4,000 |
1,500 |
8 |
4,000 |
–200 |
6,400 |
2,400 |
A monopolist can determine its profit-maximizing price and quantity by analyzing the marginal revenue and marginal costs of producing an extra unit. If the marginal revenue exceeds the marginal cost, then the firm should produce the extra unit.
英語のヒント
独占企業は、1単位を追加生産したときの限界収入と限界費用を分析し、利潤を最大化する価格と数量を決められる。限界収入が限界費用を上回れば、追加の1単位を生産すべきである。
For example, at an output of 4 in Figure 9.5, marginal revenue is 600 and marginal cost is 250, so producing this unit will clearly add to overall profits. At an output of 5, marginal revenue is 400 and marginal cost is 400, so producing this unit still means overall profits are unchanged. However, expanding output from 5 to 6 would involve a marginal revenue of 200 and a marginal cost of 850, so that sixth unit would actually reduce profits. Thus, the monopoly can tell from the marginal revenue and marginal cost that of the choices in the table, the profit-maximizing level of output is 5.
英語のヒント
たとえば、図9.5の生産量4では、限界収入が600、限界費用が250なので、この単位の生産は明らかに利潤全体を増やす。生産量5では限界収入と限界費用がともに400で、この単位を生産しても全体の利潤は変わらない。しかし、5から6への増産では限界収入が200、限界費用が850となり、6番目の単位は実際には利潤を減らす。したがって独占企業は、限界収入と限界費用から、表の選択肢の中で利潤を最大化する生産水準は5だと判断できる。
The monopoly could seek out the profit-maximizing level of output by increasing quantity by a small amount, calculating marginal revenue and marginal cost, and then either increasing output as long as marginal revenue exceeds marginal cost or reducing output if marginal cost exceeds marginal revenue. This process works without any need to calculate total revenue and total cost. Thus, a profit-maximizing monopoly should follow the rule of producing up to the quantity where marginal revenue is equal to marginal cost—that is, MR = MC. This quantity is easy to identify graphically, where MR and MC intersect.
英語のヒント
独占企業は、数量を少し増やし、限界収入と限界費用を計算して、限界収入が限界費用を上回るかぎり増産し、限界費用が限界収入を上回れば減産することで、利潤を最大化する生産水準を探せる。この過程では、総収入や総費用を計算する必要はない。したがって、利潤を最大化する独占企業は、限界収入が限界費用と等しい数量、つまりMR=MCまで生産するという規則に従うべきである。この数量は、グラフ上でMRとMCの交点として簡単に特定できる。