第22章恒星の青年期から老年期までStars from Adolescence to Old Age
22.3 Checking Out the Theory22.3 理論を確かめる
Learning Objectives学習の目標
By the end of this section, you will be able to:
この節を学ぶと、次のことができるようになる。
Explain how the H–R diagram of a star cluster can be related to the cluster’s age and the stages of evolution of its stellar members
星団のHR図を、その星団の年齢や各星の進化段階とどう結びつけられるかを説明する。
Describe how the main-sequence turnoff of a cluster reveals its age
主系列転向点から星団の年齢がどうわかるかを説明する。
In the previous section, we indicated that open clusters are younger than globular clusters, and associations are typically even younger. In this section, we will show how we determine the ages of these star clusters. The key observation is that the stars in these different types of clusters are found in different places in the H–R diagram, and we can use their locations in the diagram in combination with theoretical calculations to estimate how long they have lived.
英語のヒント
前の節では、散開星団は球状星団より若く、アソシエーションは普通さらに若いと述べた。この節では、それらの星の集団の年齢をどう求めるかを示す。鍵となる観測事実は、集団の種類によって、星がHR図の異なる場所に見つかることである。図上の位置と理論計算を組み合わせれば、どれほど長く生きてきたかを見積もれる。
H–R Diagrams of Young Clusters若い星団のHR図
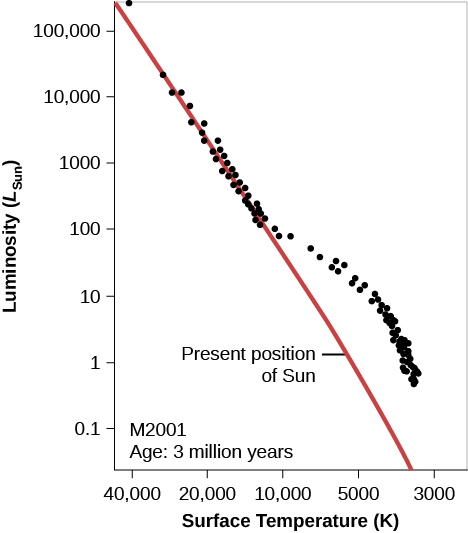
What does theory predict for the H–R diagram of a cluster whose stars have recently condensed from an interstellar cloud? Remember that at every stage of evolution, massive stars evolve more quickly than their lower-mass counterparts. After a few million years (“recently” for astronomers), the most massive stars should have completed their contraction phase and be on the main sequence, while the less massive ones should be off to the right, still on their way to the main sequence. These ideas are illustrated in Figure 22.8, which shows the H–R diagram calculated by R. Kippenhahn and his associates at Munich University for a hypothetical cluster with an age of 3 million years.
英語のヒント
星々が星間雲から最近凝縮した星団では、HR図はどんな形になると理論は予測するだろうか。どの段階でも、重い星は軽い星より速く進化することを思い出してほしい。数百万年後、天文学者には「最近」であるが、最も大質量の星は収縮を終えて主系列にいるはずである。一方、それより軽い星は、まだ主系列へ向かう途中で、その右側にいるはずである。図22.8は、ミュンヘン大学のR.キッペンハーンと共同研究者が計算した、年齢300万年の仮想星団のHR図で、この考えを示す。
Young Cluster H–R Diagram.若い星団のHR図。
OpenStax / Rice University · CC BY 4.0
Figure 22.8 We see an H–R diagram for a hypothetical young cluster with an age of 3 million years. Note that the high-mass (high-luminosity) stars have already arrived at the main-sequence stage of their lives, while the lower-mass (lower-luminosity) stars are still contracting toward the zero-age main sequence (the red line) and are not yet hot enough to derive all of their energy from the fusion of hydrogen.
図22.8 年齢300万年の仮想的な若い星団のHR図。高質量・高光度の星はすでに主系列に到達しているが、低質量・低光度の星はまだ零歳主系列の赤線へ向かって収縮している。後者は、水素核融合からすべてのエネルギーを得られるほど高温には、まだなっていない。
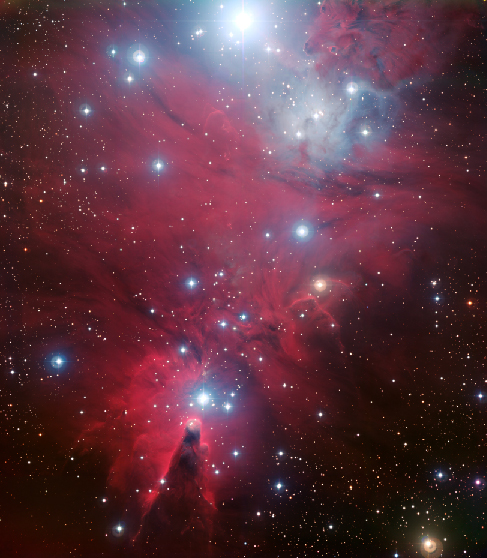
There are real star clusters that fit this description. The first to be studied (in about 1950) was NGC 2264, which is still associated with the region of gas and dust from which it was born (Figure 22.9).
英語のヒント
この説明に当てはまる星団は、実際にある。最初に研究されたのは、1950年ごろのNGC 2264だった。今も、生まれた元のガスと塵の領域を伴っている(図22.9)。
Young Cluster NGC 2264.若い星団NGC 2264。
credit: ESO · CC BY 4.0
Figure 22.9 Located about 2600 light-years from us, this region of newly formed stars, known as the Christmas Tree Cluster, is a complex mixture of hydrogen gas (which is ionized by hot embedded stars and shown in red), dark obscuring dust lanes, and brilliant young stars. The image shows a scene about 30 light-years across. (credit: ESO)
図22.9 約2600光年先の、生まれたばかりの星の領域で、クリスマスツリー星団として知られる。内部の高温星に電離され、赤く示された水素ガス、光を遮る暗い塵の筋、明るく輝く若い星が複雑に混ざり合う。画像の幅は約30光年。(出典:ESO)
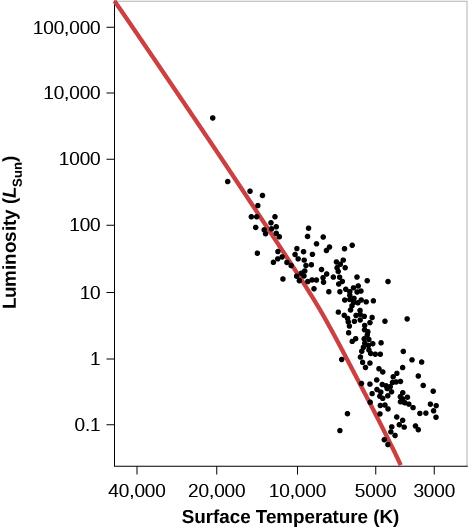
The NGC 2264 cluster’s H–R diagram is shown in Figure 22.10. The cluster in the middle of the Orion Nebula (shown in Figure 21.4 and Figure 21.5) is in a similar stage of evolution.
NGC 2264のHR図を図22.10に示す。オリオン大星雲の中央の星団も、似た進化段階にある(図21.4、図21.5)。
NGC 2264 H–R Diagram.NGC 2264のHR図。
OpenStax / Rice University · CC BY 4.0
Figure 22.10 Compare this H–R diagram to that in Figure 22.8; although the points scatter a bit more here, the theoretical and observational diagrams are remarkably, and satisfyingly, similar.
図22.10 このHR図と図22.8を比べてみよう。こちらの点は少しばらつくものの、理論と観測の図は、驚くほど、そして満足のいくほどよく似ている。
As clusters get older, their H–R diagrams begin to change. After a short time (less than a million years after they reach the main sequence), the most massive stars use up the hydrogen in their cores and evolve off the main sequence to become red giants and supergiants. As more time passes, stars of lower mass begin to leave the main sequence and make their way to the upper right of the H–R diagram.
英語のヒント
星団が年を取ると、HR図は変わり始める。最も重い恒星は、主系列に達してから100万年未満という短い時間で、中心核の水素を使い果たし、主系列を離れて赤色巨星や超巨星になる。さらに時間がたつと、より軽い星も主系列を離れ、HR図の右上へ進み始める。
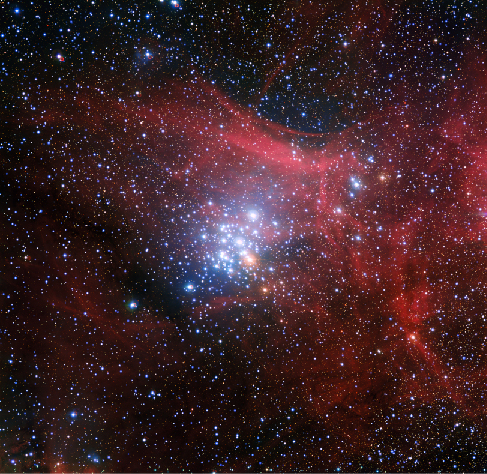
Figure 22.11 is a photograph of NGC 3293, a cluster that is about 10 million years old. The dense clouds of gas and dust are gone. One massive star has evolved to become a red giant and stands out as an especially bright orange member of the cluster.
英語のヒント
図22.11は、年齢約1000万年の星団NGC 3293の写真である。濃いガスと塵の雲はなくなっている。一つの大質量星が赤色巨星へ進化し、ひときわ明るいオレンジ色のメンバーとして目立っている。
NGC 3293.NGC 3293。
credit: ESO/G. Beccari · CC BY 4.0
Figure 22.11 All the stars in an open star cluster like NGC 3293 form at about the same time. The most massive stars, however, exhaust their nuclear fuel more rapidly and hence evolve more quickly than stars of low mass. As stars evolve, they become redder. The bright orange star in NGC 3293 is the member of the cluster that has evolved most rapidly. (credit: ESO/G. Beccari)
図22.11 NGC 3293のような散開星団では、すべての星がほぼ同時に形成される。しかし重い星ほど核燃料を速く使い果たし、軽い星より速く進化する。進化すると星は赤くなる。NGC 3293の明るいオレンジ色の星は、最も速く進化したメンバーである。(出典:ESO/G. Beccari)
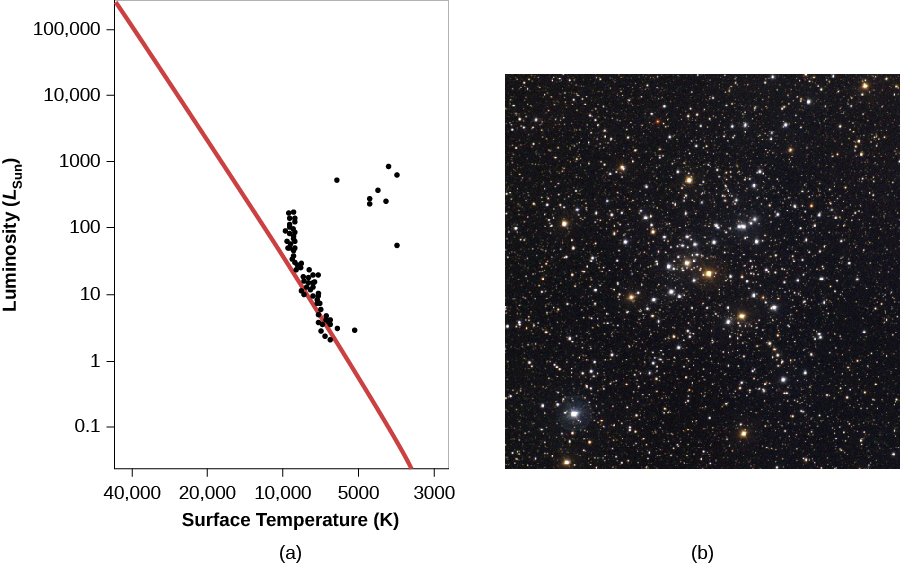
Figure 22.12 shows the H–R diagram of the open cluster M41, which is roughly 100 million years old; by this time, a significant number of stars have moved off to the right and become red giants. Note the gap that appears in this H–R diagram between the stars near the main sequence and the red giants. A gap does not necessarily imply that stars avoid a region of certain temperatures and luminosities. In this case, it simply represents a domain of temperature and luminosity through which stars evolve very quickly. We see a gap for M41 because at this particular moment, we have not caught a star in the process of scurrying across this part of the diagram.
英語のヒント
図22.12は、約1億歳の散開星団M41のHR図である。このころには、かなりの数の星が右へ移動し、赤色巨星になっている。主系列の近くの星と赤色巨星の間に、空白があることに注目しよう。空白があるからといって、星がその温度と光度の領域を避けるとは限らない。この場合は、星が非常に速く進化して通過する領域を表すだけである。M41に空白が見えるのは、ちょうど今、この図の部分を急いで横切っている星を捉えていないためである。
Cluster M41.星団M41。
credit b: modification of work by NOAO/AURA/NSF · CC BY 4.0
Figure 22.12 (a) Cluster M41 is older than NGC 2264 (see Figure 22.10) and contains several red giants. Some of its more massive stars are no longer close to the zero-age main sequence (red line). (b) This ground-based photograph shows the open cluster M41. Note that it contains several orange-color stars. These are stars that have exhausted hydrogen in their centers, and have swelled up to become red giants. (credit b: modification of work by NOAO/AURA/NSF)
図22.12 (a)M41はNGC 2264より古く(図22.10参照)、いくつかの赤色巨星を含む。重い星の一部は、もう赤線の零歳主系列の近くにはない。(b)地上から撮影した散開星団M41。オレンジ色の星がいくつかあることに注目しよう。中心の水素を使い果たし、膨張して赤色巨星になった星々である。(出典b:NOAO/AURA/NSFの作品を改変)