第15章太陽――ありふれた恒星The Sun: A Garden-Variety Star
The Chromosphere彩層
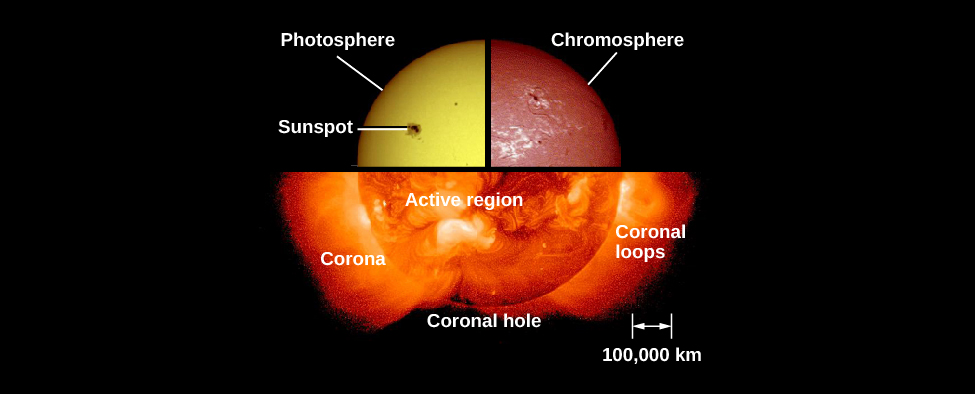
The Sun’s outer gases extend far beyond the photosphere (Figure 15.7). Because they are transparent to most visible radiation and emit only a small amount of light, these outer layers are difficult to observe. The region of the Sun’s atmosphere that lies immediately above the photosphere is called the chromosphere. Until this century, the chromosphere was visible only when the photosphere was concealed by the Moon during a total solar eclipse (see the chapter on Earth, Moon, and Sky). In the seventeenth century, several observers described what appeared to them as a narrow red “streak” or “fringe” around the edge of the Moon during a brief instant after the Sun’s photosphere had been covered. The name chromosphere, from the Greek for “colored sphere,” was given to this red streak.
英語のヒント
太陽の外側のガスは、光球をはるかに越えて広がっている(図15.7)。可視光の大部分を透過させ、自らは少ししか光を出さないため、これらの外層は観測しにくい。光球のすぐ上にある太陽大気の領域を、彩層と呼ぶ。今世紀までは、彩層を見ることができたのは、皆既日食で光球が月に隠されるときだけだった。「地球・月・空」の章を参照してほしい。17世紀には複数の観測者が、太陽の光球が隠された直後の短い瞬間、月の縁の周囲に細い赤い「筋」や「縁取り」のようなものが見えたと記している。この赤い筋に、ギリシャ語の「色の球」に由来するchromosphere、すなわち彩層という名が付いた。
The Sun’s Atmosphere.太陽の大気。
credit: modification of work by NASA · NASA media use guidelines
Figure 15.7 Composite image showing the three components of the solar atmosphere: the photosphere or surface of the Sun taken in ordinary light; the chromosphere, imaged in the light of the strong red spectral line of hydrogen (H-alpha); and the corona as seen with X-rays. (credit: modification of work by NASA)
図15.7 太陽大気の三つの部分を示す合成画像。通常の光で撮影した太陽表面、すなわち光球、水素の強い赤色スペクトル線であるHα線で撮影した彩層、そしてX線で見たコロナを組み合わせている。(クレジット:NASAの作品を改変)
Observations made during eclipses show that the chromosphere is about 2000 to 3000 kilometers thick, and its spectrum consists of bright emission lines, indicating that this layer is composed of hot gases emitting light at discrete wavelengths. The reddish color of the chromosphere arises from one of the strongest emission lines in the visible part of its spectrum—the bright red line caused by hydrogen, the element that, as we have already seen, dominates the composition of the Sun.
英語のヒント
日食中の観測によれば、彩層の厚さは約2000〜3000kmで、そのスペクトルは明るい輝線からなる。これは、この層が、とびとびの波長の光を放つ高温ガスでできていることを示す。彩層の赤みは、その可視光スペクトルで最も強い輝線の一つ、水素が生む明るい赤い線による。すでに見たように、水素は太陽の組成で最も多い元素である。
In 1868, observations of the chromospheric spectrum revealed a yellow emission line that did not correspond to any previously known element on Earth. Scientists quickly realized they had found a new element and named it helium (after helios, the Greek word for “Sun”). It took until 1895 for helium to be discovered on our planet. Today, students are probably most familiar with it as the light gas used to inflate balloons, although it turns out to be the second-most abundant element in the universe.
英語のヒント
1868年、彩層のスペクトル観測によって、地球でそれまで知られたどの元素にも対応しない、黄色の輝線が見つかった。科学者はすぐに新元素の発見だと気付き、ギリシャ語で「太陽」を意味するheliosにちなんで、ヘリウムと名付けた。地球でヘリウムが発見されたのは1895年になってからだった。今日の学生には、風船を膨らませる軽いガスとして最もなじみがあるだろうが、実は宇宙で2番目に多い元素である。
The temperature of the chromosphere is about 10,000 K. This means that the chromosphere is hotter than the photosphere, which should seem surprising. In all the situations we are familiar with, temperatures fall as one moves away from the source of heat, and the chromosphere is farther from the center of the Sun than the photosphere is.
英語のヒント
彩層の温度は約1万Kである。つまり、彩層は光球より高温で、これは意外に思えるはずだ。私たちがよく知る状況では、熱源から離れるほど温度は下がる。ところが彩層は、光球より太陽の中心から遠いところにある。
The Transition Region遷移層
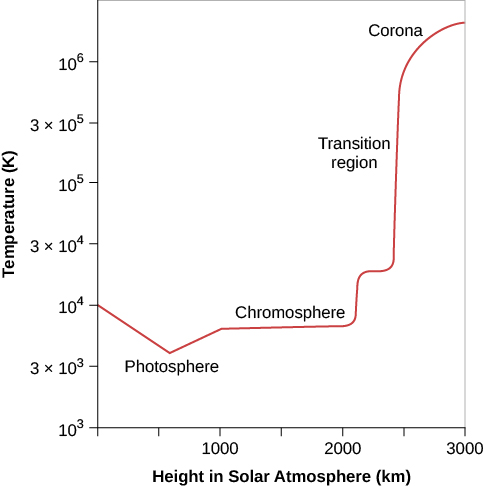
The increase in temperature does not stop with the chromosphere. Above it is a region in the solar atmosphere where the temperature changes from 10,000 K (typical of the chromosphere) to nearly a million degrees. The hottest part of the solar atmosphere, which has a temperature of a million degrees or more, is called the corona. Appropriately, the part of the Sun where the rapid temperature rise occurs is called the transition region. It is probably only a few tens of kilometers thick. Figure 15.8 summarizes how the temperature of the solar atmosphere changes from the photosphere outward.
英語のヒント
温度の上昇は彩層で終わらない。その上には、彩層の典型的な温度である1万Kから、100万度近くまで温度が変わる太陽大気の領域がある。太陽大気で最も高温の部分はコロナと呼ばれ、温度は100万度以上である。この急激な温度上昇が起こる部分は、その名もふさわしく遷移層と呼ばれる。厚さはおそらくわずか数十kmである。図15.8は、光球から外へ向かって太陽大気の温度がどのように変わるかをまとめている。
Temperatures in the Solar Atmosphere.太陽大気の温度。
OpenStax / Rice University · CC BY 4.0
Figure 15.8 On this graph, temperature is shown increasing upward, and height above the photosphere is shown increasing to the right. Note the very rapid increase in temperature over a very short distance in the transition region between the chromosphere and the corona.
図15.8 このグラフでは、上へ行くほど温度が高く、右へ行くほど光球からの高さが大きい。彩層とコロナの間の遷移層で、ごく短い距離の間に温度がきわめて急に上昇することに注目しよう。
In 2013, NASA launched the Interface Region Imaging Spectrograph (IRIS) to study the transition region to understand better how and why this sharp temperature increase occurs. IRIS is the first space mission that is able to obtain high spatial resolution images of the different features produced over this wide temperature range and to see how they change with time and location (Figure 15.9).
英語のヒント
2013年、NASAは遷移層を研究するため、界面領域撮像分光衛星IRISを打ち上げた。この鋭い温度上昇がどのように、またなぜ起こるかを、よりよく理解するためである。IRISは、この広い温度範囲で生じるさまざまな構造を、高い空間分解能の画像として取得し、それらが時間や場所によってどう変わるかを調べられる、初めての宇宙観測計画である(図15.9)。
Portion of the Transition Region.遷移層の一部。
Figure 15.9 This image shows a giant ribbon of relatively cool gas threading through the lower portion of the hot corona. This ribbon (the technical term is filament) is made up of many individual threads. Time-lapse movies of this filament showed that it gradually heated as it moved through the corona. Scientists study events like this in order to try to understand what heats the chromosphere and corona to high temperatures. The “whiskers” at the edge of the Sun are spicules, jets of gas that shoot material up from the Sun’s surface and disappear after only a few minutes. This single image gives a hint of just how complicated it is to construct a model of the all the different structures and heating mechanisms in the solar atmosphere. (credit: JAXA/NASA/Hinode)
図15.9 この画像には、比較的低温のガスの巨大なリボンが、高温のコロナの下部を縫うように通っている。このリボンは専門的にはフィラメントと呼ばれ、多数の細い糸状構造からできている。微速度撮影の動画では、フィラメントがコロナを移動するにつれて、徐々に加熱される様子が見られた。科学者は、このような現象を調べ、何が彩層やコロナを高温に加熱するのかを理解しようとしている。太陽の縁の「ひげ」はスピキュールで、太陽表面から物質を噴き上げ、わずか数分後に消えるガスの噴流である。この1枚の画像だけでも、太陽大気の多様な構造と加熱の仕組みをすべて含むモデルを作るのが、どれほど複雑かがうかがえる。(クレジット:JAXA/NASA/Hinode)
Figure 15.4 and the red graph in Figure 15.8 make the Sun seem rather like an onion, with smooth spherical shells, each one with a different temperature. For a long time, astronomers did indeed think of the Sun this way. However, we now know that while this idea of layers—photosphere, chromosphere, transition region, corona—describes the big picture fairly well, the Sun’s atmosphere is really more complicated, with hot and cool regions intermixed. For example, clouds of carbon monoxide gas with temperatures colder than 4000 K have now been found at the same height above the photosphere as the much hotter gas of the chromosphere.
英語のヒント
図15.4と図15.8の赤いグラフを見ると、太陽はいくつもの滑らかな球殻が重なり、それぞれ温度が異なる、タマネギのように思える。長い間、天文学者も実際にそう考えていた。しかし今では、光球・彩層・遷移層・コロナという層の考え方は大筋をかなりよく説明するものの、実際の太陽大気はもっと複雑で、高温と低温の領域が混在していると分かっている。例えば、はるかに高温な彩層のガスと、光球から同じ高さに、4000Kより低温の一酸化炭素ガスの雲が見つかっている。
The Coronaコロナ
The outermost part of the Sun’s atmosphere is called the corona. Like the chromosphere, the corona was first observed during total eclipses (Figure 15.10). Unlike the chromosphere, the corona has been known for many centuries: it was referred to by the Roman historian Plutarch and was discussed in some detail by Kepler.
英語のヒント
太陽大気の最も外側の部分は、コロナと呼ばれる。彩層と同じく、コロナも皆既日食で初めて観測された(図15.10)。しかし彩層とは違い、コロナは何世紀も前から知られていた。ローマの歴史家プルタルコスが言及し、ケプラーもある程度詳しく論じている。
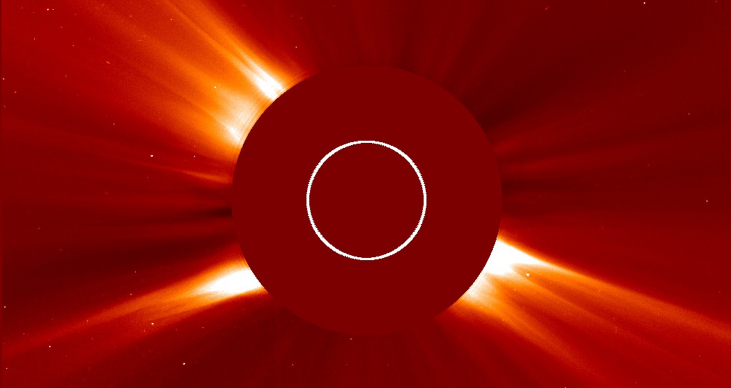
The corona extends millions of kilometers above the photosphere and emits about half as much light as the full moon. The reason we don’t see this light until an eclipse occurs is the overpowering brilliance of the photosphere. Just as bright city lights make it difficult to see faint starlight, so too does the intense light from the photosphere hide the faint light from the corona. While the best time to see the corona from Earth is during a total solar eclipse, it can be observed easily from orbiting spacecraft. Its brighter parts can now be photographed with a special instrument—a coronagraph—that removes the Sun’s glare from the image with an occulting disk (a circular piece of material held so it is just in front of the Sun).
英語のヒント
コロナは光球から数百万km上まで広がり、満月の約半分の光を放つ。日食になるまでこの光を見られない理由は、光球の圧倒的な明るさにある。明るい街明かりが淡い星明かりを見えにくくするのと同じように、光球の強烈な光がコロナの淡い光を隠す。地球からコロナを見る最良の機会は皆既日食だが、周回する宇宙機からなら容易に観測できる。比較的明るい部分は、現在ではコロナグラフという特殊な装置で撮影できる。この装置は、太陽のちょうど手前に円形の遮蔽物を置く遮光円盤によって、太陽のまぶしい光を画像から取り除く。
Coronagraph.コロナグラフ。
credit: modification of work by NASA/SOHO · NASA media use guidelines
Figure 15.10 This image of the Sun was taken March 2, 2016. The larger dark circle in the center is the disk that blocks the Sun’s glare, allowing us to see the corona. The smaller inner circle is where the Sun would be if it were visible in this image. (credit: modification of work by NASA/SOHO)
図15.10 この太陽画像は2016年3月2日に撮影された。中央の大きな暗い円が、太陽のまぶしい光を遮る円盤であり、コロナを見えるようにしている。内側の小さな円は、もしこの画像で太陽が見えていたなら、太陽が位置する場所を示す。(クレジット:NASA/SOHOの作品を改変)
Studies of its spectrum show the corona to be very low in density. At the bottom of the corona, there are only about 109 atoms per cubic centimeter, compared with about 1016 atoms per cubic centimeter in the upper photosphere and 1019 molecules per cubic centimeter at sea level in Earth’s atmosphere. The corona thins out very rapidly at greater heights, where it corresponds to a high vacuum by Earth laboratory standards.
英語のヒント
スペクトルを調べると、コロナの密度は非常に低いと分かる。コロナの底には、1cm³当たり約10⁹個の原子しかない。これに対し、光球の上部には1cm³当たり約10¹⁶個の原子が、地球大気の海面高度には1cm³当たり10¹⁹個の分子がある。さらに高い場所では、コロナは急速に薄くなり、地上の実験室の基準では高真空に相当する。