第19章天体までの距離Celestial Distances
19.4 The H–R Diagram and Cosmic Distances19.4 H–R図と宇宙の距離
Learning Objectives学習の目標
By the end of this section, you will be able to:
この節を学ぶと、次のことができるようになる。
Understand how spectral types are used to estimate stellar luminosities
スペクトル型を使って恒星の光度を見積もる方法を理解する。
Examine how these techniques are used by astronomers today
天文学者が現在、これらの方法をどのように使っているかを検討する。
Variable stars are not the only way that we can estimate the luminosity of stars. Another way involves the H–R diagram, which shows that the intrinsic brightness of a star can be estimated if we know its spectral type.
英語のヒント
恒星の光度を見積もる方法は、変光星だけではない。もう一つはH–R図を使う方法である。この図からは、スペクトル型が分かれば、星の本来の明るさを推定できると分かる。
Distances from Spectral Typesスペクトル型から距離を求める
As satisfying and productive as variable stars have been for distance measurement, these stars are rare and are not found near all the objects to which we wish to measure distances. Suppose, for example, we need the distance to a star that is not varying, or to a group of stars, none of which is a variable. In this case, it turns out the H–R diagram can come to our rescue.
英語のヒント
変光星は距離測定で満足のいく成果を上げてきたが、数が少なく、距離を測りたい天体の近くに、必ずあるとは限らない。例えば、変光しない星までの距離や、変光星を一つも含まない星の集団までの距離が必要になったとしよう。このような場合、助けになるのがH–R図である。
If we can observe the spectrum of a star, we can estimate its distance from our understanding of the H–R diagram. As discussed in Analyzing Starlight, a detailed examination of a stellar spectrum allows astronomers to classify the star into one of the spectral types indicating surface temperature. (The types are O, B, A, F, G, K, M, L, T, and Y; each of these can be divided into numbered subgroups.) In general, however, the spectral type alone is not enough to allow us to estimate luminosity. Look again at Figure 18.15. A G2 star could be a main-sequence star with a luminosity of 1 LSun, or it could be a giant with a luminosity of 100 LSun, or even a supergiant with a still higher luminosity.
英語のヒント
恒星のスペクトルを観測できれば、H–R図についての知識から距離を見積もれる。「星の光を分析する」で述べたように、スペクトルを詳しく調べることで、表面温度を示すスペクトル型のいずれかに分類できる。型にはO、B、A、F、G、K、M、L、T、Yがあり、それぞれを数字付きの小分類に分けられる。しかし一般に、スペクトル型だけでは光度を見積もれない。図18.15をもう一度見てほしい。G2型星は、光度が太陽の1倍の主系列星かもしれないし、100倍の巨星かもしれないし、さらに明るい超巨星かもしれない。
We can learn more from a star’s spectrum, however, than just its temperature. Remember, for example, that we can detect pressure differences in stars from the details of the spectrum. This knowledge is very useful because giant stars are larger (and have lower pressures) than main-sequence stars, and supergiants are still larger than giants. If we look in detail at the spectrum of a star, we can determine whether it is a main-sequence star, a giant, or a supergiant.
英語のヒント
しかし、星のスペクトルから分かるのは、温度だけではない。例えばスペクトルの細部から、星の圧力の違いを検出できることを思い出そう。この知識はとても役立つ。巨星は主系列星より大きく、圧力が低い。そして超巨星は巨星より、さらに大きいからだ。スペクトルを詳しく見れば、主系列星なのか、巨星なのか、超巨星なのかを判定できる。
Suppose, to start with the simplest example, that the spectrum, color, and other properties of a distant G2 star match those of the Sun exactly. It is then reasonable to conclude that this distant star is likely to be a main-sequence star just like the Sun and to have the same luminosity as the Sun. But if there are subtle differences between the solar spectrum and the spectrum of the distant star, then the distant star may be a giant or even a supergiant.
英語のヒント
最も簡単な例から始めよう。遠方のG2型星のスペクトル、色、その他の性質が、太陽のものとぴったり一致するとする。その場合、この星も太陽と同じ主系列星で、同じ光度を持つ可能性が高い、と結論するのは妥当である。しかし太陽とその星のスペクトルに微妙な違いがあれば、遠方の星は巨星、あるいは超巨星かもしれない。
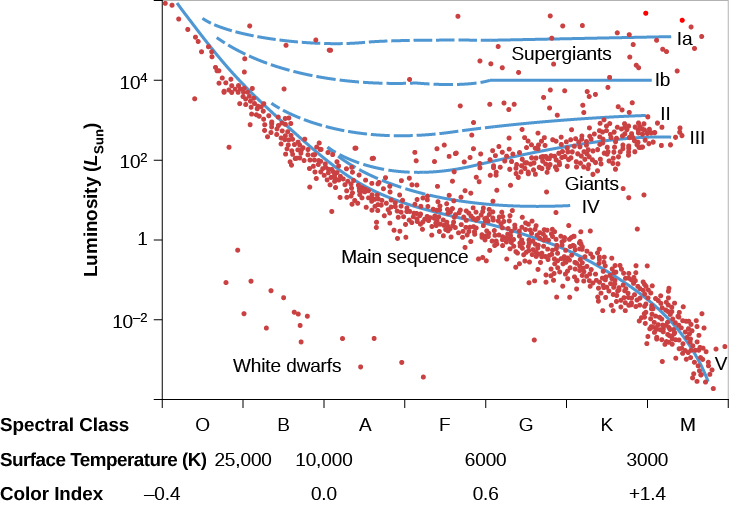
The most widely used system of star classification divides stars of a given spectral class into six categories called luminosity classes. These luminosity classes are denoted by Roman numbers as follows:
英語のヒント
最も広く使われる恒星の分類体系では、同じスペクトル型の星を、光度階級と呼ぶ六つの区分に分ける。次のように、ローマ数字で表す。
Ia: Brightest supergiants
Ia:最も明るい超巨星
Ib: Less luminous supergiants
Ib:比較的暗い超巨星
II: Bright giants
II:輝巨星
III: Giants
III:巨星
IV: Subgiants (intermediate between giants and main-sequence stars)
IV:準巨星(巨星と主系列星の中間)
V: Main-sequence stars
V:主系列星
The full spectral specification of a star includes its luminosity class. For example, a main-sequence star with spectral class F3 is written as F3 V. The specification for an M2 giant is M2 III. Figure 19.15 illustrates the approximate position of stars of various luminosity classes on the H–R diagram. The dashed portions of the lines represent regions with very few or no stars.
英語のヒント
恒星のスペクトルを完全に指定するときは、光度階級も含める。例えばF3型の主系列星はF3 V、M2型の巨星はM2 IIIと書く。図19.15は、さまざまな光度階級の星がH–R図でおおよそどこにあるかを示す。破線の部分は、星がごく少ないか、まったくない領域を表す。
Luminosity Classes.光度階級
OpenStax / Rice University · CC BY 4.0
Figure 19.15 Stars of the same temperature (or spectral class) can fall into different luminosity classes on the Hertzsprung-Russell diagram. By studying details of the spectrum for each star, astronomers can determine which luminosity class they fall in (whether they are main-sequence stars, giant stars, or supergiant stars).
図19.15 温度、あるいはスペクトル型が同じ星でも、H–R図では異なる光度階級に属することがある。それぞれのスペクトルを詳しく調べれば、主系列星、巨星、超巨星のどれか、つまりどの光度階級に属するかを判定できる。
With both its spectral and luminosity classes known, a star’s position on the H–R diagram is uniquely determined. Since the diagram plots luminosity versus temperature, this means we can now read off the star’s luminosity (once its spectrum has helped us place it on the diagram). As before, if we know how luminous the star really is and see how dim it looks, the difference allows us to calculate its distance. (For historical reasons, astronomers sometimes call this method of distance determination spectroscopic parallax, even though the method has nothing to do with parallax.)
英語のヒント
スペクトル型と光度階級の両方が分かると、H–R図での星の位置が一意に定まる。この図は光度と温度を対応させたものなので、スペクトルから図上の位置を決めたあとは、星の光度を読み取れる。これまでと同様、本当の明るさが分かり、見かけの暗さを測れば、両者の違いから距離を計算できる。歴史的な理由から、天文学者はこの方法を分光視差と呼ぶことがあるが、実際には視差とは何の関係もない。
The H–R diagram method allows astronomers to estimate distances to nearby stars, as well as some of the most distant stars in our Galaxy, but it is anchored by measurements of parallax. The distances measured using parallax are the gold standard for distances: they rely on no assumptions, only geometry. Once astronomers take a spectrum of a nearby star for which we also know the parallax, we know the luminosity that corresponds to that spectral type. Nearby stars thus serve as benchmarks for more distant stars because we can assume that two stars with identical spectra have the same intrinsic luminosity.
英語のヒント
H–R図による方法では、近くの星だけでなく、天の川銀河の中でも特に遠い星の距離を見積もれる。ただし、その基準は視差測定に支えられている。視差による距離は、仮定に頼らず、幾何学だけを使う、距離測定の基準なのである。視差も分かっている近くの恒星のスペクトルを得れば、そのスペクトル型に対応する光度が分かる。スペクトルが同じ二つの星は、本来の光度も同じと仮定できるため、近くの星が、遠い星の基準として働くのだ。
A Few Words about the Real World実際の研究について、ひと言
Introductory textbooks such as ours work hard to present the material in a straightforward and simplified way. In doing so, we sometimes do our students a disservice by making scientific techniques seem too clean and painless. In the real world, the techniques we have just described turn out to be messy and difficult, and often give astronomers headaches that last long into the day.
英語のヒント
この本のような入門教科書は、内容を分かりやすく、単純化して示そうと努力する。そのために、科学の方法を整然と簡単なものに見せすぎて、かえって学ぶ人のためにならないこともある。現実には、ここまで説明した方法は複雑で難しく、天文学者を一日の長い時間、悩ませることも多い。
For example, the relationships we have described such as the period-luminosity relation for certain variable stars aren’t exactly straight lines on a graph. The points representing many stars scatter widely when plotted, and thus, the distances derived from them also have a certain built-in scatter or uncertainty.
英語のヒント
例えば、ある種の変光星の周期–光度関係など、ここで紹介した関係は、グラフにすると完全な直線になるわけではない。多くの星を表す点は、プロットすると広く散らばる。そのため、そこから求めた距離にも、もともとある程度のばらつきや不確かさが含まれる。
The distances we measure with the methods we have discussed are therefore only accurate to within a certain percentage of error—sometimes 10%, sometimes 25%, sometimes as much as 50% or more. A 25% error for a star estimated to be 10,000 light-years away means it could be anywhere from 7500 to 12,500 light-years away. This would be an unacceptable uncertainty if you were loading fuel into a spaceship for a trip to the star, but it is not a bad first figure to work with if you are an astronomer stuck on planet Earth.
英語のヒント
したがって、ここで説明した方法による距離は、一定の割合の誤差の範囲でしか正確ではない。10%の場合もあれば25%、ときには50%以上のこともある。距離を1万光年と見積もった星に25%の誤差があるなら、実際には7500〜1万2500光年のどこにあってもおかしくない。その星へ向かう宇宙船に燃料を積むなら、到底受け入れられない不確かさだろう。しかし地球から動けない天文学者にとっては、研究の出発点として悪い数字ではない。
Nor is the construction of H–R diagrams as easy as you might think at first. To make a good diagram, one needs to measure the characteristics and distances of many stars, which can be a time-consuming task. Since our own solar neighborhood is already well mapped, the stars astronomers most want to study to advance our knowledge are likely to be far away and faint. It may take hours of observing to obtain a single spectrum. Observers may have to spend many nights at the telescope (and many days back home working with their data) before they get their distance measurement. Fortunately, this is changing because surveys like Gaia will study billions of stars, producing public datasets that all astronomers can use.
英語のヒント
H–R図を作るのも、最初に思うほど簡単ではない。よい図を作るには、多くの星の性質と距離を測らねばならず、時間のかかる作業になりうる。太陽の近所はすでに詳しく調べられているので、知識を前進させるために最も調べたい星は、遠くて暗いことが多い。一つのスペクトルを得るだけで、何時間も観測することがある。距離が測れるまでには、望遠鏡で何晩も過ごし、自宅へ戻ってからも何日もデータを扱わなければならないかもしれない。幸い、この状況は変わりつつある。ガイアのような調査が何十億もの星を調べ、すべての天文学者が使える公開データを生み出すからだ。
Despite these difficulties, the tools we have been discussing allow us to measure a remarkable range of distances—parallaxes for the nearest stars, RR Lyrae variable stars; the H–R diagram for clusters of stars in our own and nearby galaxies; and cepheids out to distances of 60 million light-years. Table 19.1 describes the distance limits and overlap of each method.
英語のヒント
こうした困難があっても、ここで述べた手段を使えば、驚くほど広い範囲の距離を測れる。最も近い星には視差を使い、こと座RR型変光星やH–R図を天の川銀河と近隣の銀河の星団に使い、セファイドなら6000万光年先まで届く。表19.1は、各方法で測れる距離の範囲と、その重なりを示す。
Each technique described in this chapter builds on at least one other method, forming what many call the cosmic distance ladder. Parallaxes are the foundation of all stellar distance estimates, spectroscopic methods use nearby stars to calibrate their H–R diagrams, and RR Lyrae and cepheid distance estimates are grounded in H–R diagram distance estimates (and even in a parallax measurement to a nearby cepheid, Delta Cephei).
英語のヒント
この章で説明した各方法は、少なくとも一つ、別の方法を土台としている。これを多くの人が、宇宙の距離はしごと呼ぶ。すべての恒星の距離推定の基礎が視差である。スペクトルを使う方法では、近くの星を使ってH–R図を較正する。そして、こと座RR型星やセファイドによる距離推定は、H–R図から求めた距離を基準としている。近くのセファイド、ケフェウス座δ星の視差測定も、その基準になっている。
This chain of methods allows astronomers to push the limits when looking for even more distant stars. Recent work, for example, has used RR Lyrae stars to identify dim companion galaxies to our own Milky Way out at distances of 300,000 light-years. The H–R diagram method was recently used to identify the two most distant stars in the Galaxy: red giant stars way out in the halo of the Milky Way with distances of almost 1 million light-years.
英語のヒント
この一連の方法を使うことで、天文学者は、さらに遠い星を探すときの限界を押し広げられる。例えば近年の研究では、こと座RR型星を使い、30万光年先までにある、天の川銀河に伴う暗い銀河を見つけた。H–R図による方法も、天の川銀河で最も遠い二つの星を見つけるのに使われた。いずれもハローのはるか外側にある赤色巨星で、距離はほぼ100万光年である。
We can combine the distances we find for stars with measurements of their composition, luminosity, and temperature—made with the techniques described in Analyzing Starlight and The Stars: A Celestial Census. Together, these make up the arsenal of information we need to trace the evolution of stars from birth to death, the subject to which we turn in the chapters that follow.
英語のヒント
こうして求めた恒星までの距離は、「星の光を分析する」と「恒星――星の世界の実態を調べる」で説明した方法による、組成、光度、温度の測定と組み合わせられる。これらを合わせると、恒星が誕生から死まで、どう進化するかをたどるための、豊富な情報がそろう。続く章では、その問題に目を向ける。
Distance Range of Celestial Measurement Methods 天体の距離測定法が届く範囲 |
|
|---|---|
Method 方法 |
Distance Range 距離の範囲 |
Trigonometric parallax 三角視差 |
4–30,000 light-years when the Gaia mission is complete ガイア計画の完了時には、4〜3万光年 |
RR Lyrae stars こと座RR型星 |
Out to 300,000 light-years 30万光年先まで |
H–R diagram and spectroscopic distances H–R図と分光学的な距離 |
Out to 1,200,000 light-years 120万光年先まで |
Cepheid stars セファイド |
Out to 60,000,000 light-years 6000万光年先まで |