第18章恒星――星の世界の実態を調べるThe Stars: A Celestial Census
Features of the H–R DiagramH–R図の特徴
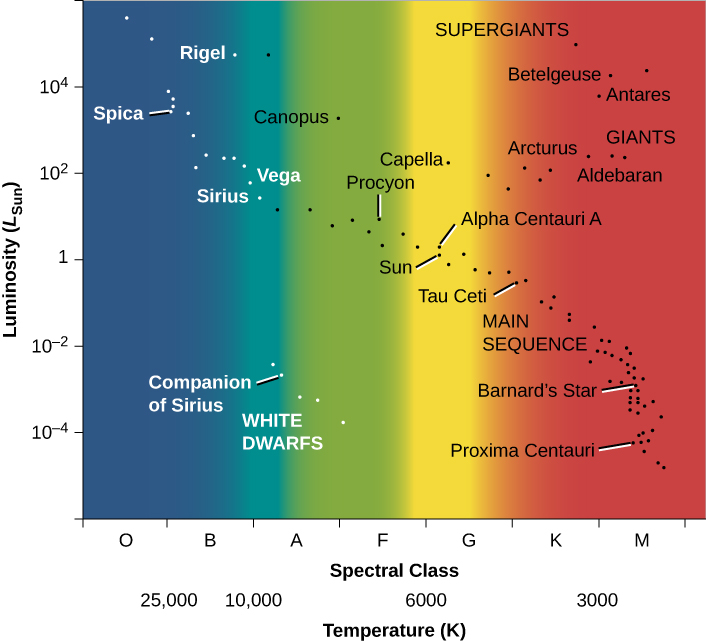
Following Hertzsprung and Russell, let us plot the temperature (or spectral class) of a selected group of nearby stars against their luminosity and see what we find (Figure 18.14). Such a plot is frequently called the Hertzsprung–Russell diagram, abbreviated H–R diagram. It is one of the most important and widely used diagrams in astronomy, with applications that extend far beyond the purposes for which it was originally developed more than a century ago.
英語のヒント
ヘルツシュプルングとラッセルに倣い、近くの恒星から選んだ一群について、温度、またはスペクトル型を、光度に対して描き、何が見つかるか見てみよう(図18.14)。このようなグラフは、ヘルツシュプルング–ラッセル図、略してH–R図と呼ばれる。天文学で最も重要で、最も広く使われる図の一つであり、その用途は、1世紀以上前に初めて考案されたときの目的を、はるかに超えている。
H–R Diagram for a Selected Sample of Stars.選んだ恒星の標本のH–R図
OpenStax / Rice University · CC BY 4.0
Figure 18.14 In such diagrams, luminosity is plotted along the vertical axis. Along the horizontal axis, we can plot either temperature or spectral type (also sometimes called spectral class). Several of the brightest stars are identified by name. Most stars fall on the main sequence.
図18.14 このような図では、縦軸に光度を取る。横軸には、温度またはスペクトル型を取れる。特に明るい恒星のいくつかは名前を記してある。ほとんどの恒星は主系列に位置する。
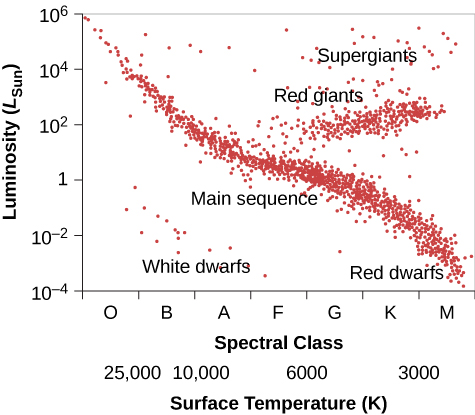
It is customary to plot H–R diagrams in such a way that temperature increases toward the left and luminosity toward the top. Notice the similarity to our plot of height and weight for people (Figure 18.12). Stars, like people, are not distributed over the diagram at random, as they would be if they exhibited all combinations of luminosity and temperature. Instead, we see that the stars cluster into certain parts of the H–R diagram. The great majority are aligned along a narrow sequence running from the upper left (hot, highly luminous) to the lower right (cool, less luminous). This band of points is called the main sequence. It represents a relationship between temperature and luminosity that is followed by most stars. We can summarize this relationship by saying that hotter stars are more luminous than cooler ones.
英語のヒント
H–R図では、温度が左へ行くほど高く、光度が上へ行くほど高くなるように描くのが慣例である。図18.12の人間の身長・体重の図と似ていることに注目しよう。恒星も人間と同じく、図全体に無作為には散らばらない。光度と温度のあらゆる組み合わせを取るなら、そうなるはずだが、実際には、H–R図の特定の部分へ集まる。圧倒的多数は、高温・高光度の左上から、低温・低光度の右下へ走る細い列に沿う。この点の帯を主系列と呼ぶ。ほとんどの恒星が従う、温度と光度の関係を表すものだ。この関係は、高温の星ほど低温の星より光度が高い、とまとめられる。
A number of stars, however, lie above the main sequence on the H–R diagram, in the upper-right region, where stars have low temperature and high luminosity. How can a star be at once cool, meaning each square meter on the star does not put out all that much energy, and yet very luminous? The only way is for the star to be enormous—to have so many square meters on its surface that the total energy output is still large. These stars must be giants or supergiants, the stars of huge diameter we discussed earlier.
英語のヒント
しかし、H–R図の主系列より上、低温・高光度の右上の領域にも、多くの星がある。星が低温、つまり1平方メートルあたりではあまり大きなエネルギーを放たないのに、同時に非常に光度が高いことは、どうすれば可能だろうか。唯一の方法は、星がとてつもなく大きいことだ。表面積が極めて大きければ、放出する全エネルギーはなお大きくなる。この星々は、前に述べた、巨大な直径をもつ巨星や超巨星でなければならない。
There are also some stars in the lower-left corner of the diagram, which have high temperature and low luminosity. If they have high surface temperatures, each square meter on that star puts out a lot of energy. How then can the overall star be dim? It must be that it has a very small total surface area; such stars are known as white dwarfs (white because, at these high temperatures, the colors of the electromagnetic radiation that they emit blend together to make them look bluish-white). We will say more about these puzzling objects in a moment. Figure 18.15 is a schematic H–R diagram for a large sample of stars, drawn to make the different types more apparent.
英語のヒント
図の左下にも、高温・低光度の星がいくらかある。表面温度が高ければ、1平方メートルあたりからは多くのエネルギーが出る。それなのに、星全体が暗いのはなぜだろうか。全表面積が非常に小さいに違いない。このような星は白色矮星として知られる。この高温では、放つ電磁放射の色が混ざって青白く見えるため、「白色」と呼ぶ。この不思議な天体については、まもなくさらに説明する。図18.15は、多数の恒星のH–R図を模式的に示したもので、異なる種類がよりはっきりわかるように描いている。
Schematic H–R Diagram for Many Stars.多数の恒星のH–R図の模式図
OpenStax / Rice University · CC BY 4.0
Figure 18.15 Ninety percent of all stars on such a diagram fall along a narrow band called the main sequence. A minority of stars are found in the upper right; they are both cool (and hence red) and bright, and must be giants. Some stars fall in the lower left of the diagram; they are both hot and dim, and must be white dwarfs.
図18.15 このような図の恒星の90%は、主系列という細い帯に沿って位置する。少数の星は右上にあり、低温で、したがって赤く、それでも明るいため、巨星であるはずだ。左下にもいくらか星があり、高温なのに暗いので、白色矮星でなければならない。
Now, think back to our discussion of star surveys. It is difficult to plot an H–R diagram that is truly representative of all stars because most stars are so faint that we cannot see those outside our immediate neighborhood. The stars plotted in Figure 18.14 were selected because their distances are known. This sample omits many intrinsically faint stars that are nearby but have not had their distances measured, so it shows fewer faint main-sequence stars than a “fair” diagram would. To be truly representative of the stellar population, an H–R diagram should be plotted for all stars within a certain distance. Unfortunately, our knowledge is reasonably complete only for stars within 10 to 20 light-years of the Sun, among which there are no giants or supergiants. Still, from many surveys (and more can now be done with new, more powerful telescopes), we estimate that about 90% of the true stars overall (excluding brown dwarfs) in our part of space are main-sequence stars, about 10% are white dwarfs, and fewer than 1% are giants or supergiants.
英語のヒント
恒星のサーベイについての話を思い出そう。あらゆる恒星を本当に代表するH–R図を描くのは難しい。大部分の星は非常に暗く、すぐ近所の外にあるものは見えないためである。図18.14の星々は、距離がわかっていることを理由に選ばれている。この標本は、近くにあって本来暗い星でも、距離が測られていないものを多数含まない。そのため、「公正な」図に比べ、暗い主系列星が少なく描かれる。恒星集団を本当に代表するには、一定の距離内にあるすべての星でH–R図を作るべきである。残念ながら、かなり完全に把握できているのは、太陽から10〜20光年以内の星だけで、そこには巨星も超巨星もない。それでも、多くのサーベイから、私たちの宇宙の近隣領域では、褐色矮星を除く本当の恒星全体の約90%が主系列星、約10%が白色矮星、1%未満が巨星または超巨星だと推定している。新たな、より強力な望遠鏡によって、今ではさらに多くのサーベイを行える。
These estimates can be used directly to understand the lives of stars. Permit us another quick analogy with people. Suppose we survey people just like astronomers survey stars, but we want to focus our attention on the location of young people, ages 6 to 18 years. Survey teams fan out and take data about where such youngsters are found at all times during a 24-hour day. Some are found in the local pizza parlor, others are asleep at home, some are at the movies, and many are in school. After surveying a very large number of young people, one of the things that the teams determine is that, averaged over the course of the 24 hours, one-third of all youngsters are found in school.
英語のヒント
この推定は、恒星の一生の理解に直接使える。もう一度、人間に少したとえてみよう。天文学者が恒星を調べるように人間を調査するが、6〜18歳の若者がどこにいるかに注目するとする。調査チームは各地へ広がり、24時間のあらゆる時刻に、その年齢の人がどこにいるかを記録する。近所のピザ店にいる人、家で眠る人、映画を見る人もいるが、多くは学校にいる。非常に多くの若者を調べた結果の一つとして、24時間を通じて平均すると、全員の3分の1が学校にいるとわかった。
How can they interpret this result? Does it mean that two-thirds of students are truants and the remaining one-third spend all their time in school? No, we must bear in mind that the survey teams counted youngsters throughout the full 24-hour day. Some survey teams worked at night, when most youngsters were at home asleep, and others worked in the late afternoon, when most youngsters were on their way home from school (and more likely to be enjoying a pizza). If the survey was truly representative, we can conclude, however, that if an average of one-third of all youngsters are found in school, then humans ages 6 to 18 years must spend about one-third of their time in school.
英語のヒント
この結果をどう解釈できるだろうか。生徒の3分の2が学校をさぼり、残り3分の1がずっと学校にいるという意味だろうか。そうではない。調査チームは1日24時間全体を通じて数えたことを、忘れてはいけない。ほとんどが家で眠っている夜に調査したチームもあれば、学校から帰る途中で、ピザを楽しんでいる可能性も高い午後遅くに調査したチームもあった。しかし、調査が本当に集団を代表しているなら、若者全体の平均3分の1が学校にいるということから、6〜18歳の人間は、時間の約3分の1を学校で過ごすはずだと結論できる。
We can do something similar for stars. We find that, on average, 90% of all stars are located on the main sequence of the H–R diagram. If we can identify some activity or life stage with the main sequence, then it follows that stars must spend 90% of their lives in that activity or life stage.
英語のヒント
恒星でも似たことができる。平均すると、全恒星の90%はH–R図の主系列に位置する。主系列を、ある活動や一生のある段階と結びつけられるなら、恒星は一生の90%を、その活動や段階に費やすはずだということになる。