第18章恒星――星の世界の実態を調べるThe Stars: A Celestial Census
18.4 The H–R Diagram18.4 H–R図
Learning Objectives学習の目標
By the end of this section, you will be able to:
この節を読み終えたら、次のことができるようになる。
Identify the physical characteristics of stars that are used to create an H–R diagram, and describe how those characteristics vary among groups of stars
H–R図を作るのに用いる恒星の物理的性質を挙げ、恒星の集団ごとに、それらがどう異なるかを説明する。
Discuss the physical properties of most stars found at different locations on the H–R diagram, such as radius, and for main sequence stars, mass
H–R図の各位置にある恒星の大部分について、半径などの物理的性質を説明し、主系列星については質量も説明する。
In this chapter and Analyzing Starlight, we described some of the characteristics by which we might classify stars and how those are measured. These ideas are summarized in Table 18.2. We have also given an example of a relationship between two of these characteristics in the mass-luminosity relation. When the characteristics of large numbers of stars were measured at the beginning of the twentieth century, astronomers were able to begin a deeper search for patterns and relationships in these data.
英語のヒント
この章と「星の光を分析する」では、恒星の分類に使える性質と、その測定方法の一部を説明した。表18.2にまとめてある。また、二つの性質の間の関係の例として、質量–光度関係を示した。20世紀の初め、多数の恒星の性質が測定されると、天文学者はデータの中のパターンや関係を、より深く探り始められるようになった。
Measuring the Characteristics of Stars 恒星の性質の測定 |
|
|---|---|
Characteristic 性質 |
Technique 方法 |
Surface temperature 表面温度 |
1. Determine the color (very rough). 1. 色を調べる。非常に大まかな推定になる。 2. Measure the spectrum and get the spectral type. 2. スペクトルを測り、スペクトル型を求める。 |
Chemical composition 化学組成 |
Determine which lines are present in the spectrum. スペクトルにどの線があるかを調べる。 |
Luminosity 光度 |
Measure the apparent brightness and compensate for distance. 見かけの明るさを測り、距離の影響を補正する。 |
Radial velocity 視線速度 |
Measure the Doppler shift in the spectrum. スペクトルのドップラーシフトを測る。 |
Rotation 自転 |
Measure the width of spectral lines. スペクトル線の幅を測る。 |
Mass 質量 |
Measure the period and radial velocity curves of spectroscopic binary stars. 分光連星の周期と視線速度曲線を測る。 |
Diameter 直径 |
1. Measure the way a star’s light is blocked by the Moon. 1. 月に恒星の光が遮られる様子を測る。 2. Measure the light curves and Doppler shifts for eclipsing binary stars. 2. 食連星の光度曲線とドップラーシフトを測る。 |
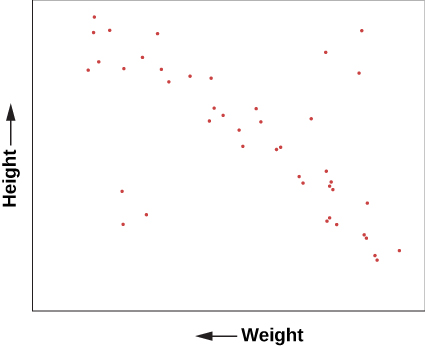
To help understand what sorts of relationships might be found, let’s look briefly at a range of data about human beings. If you want to understand humans by comparing and contrasting their characteristics—without assuming any previous knowledge of these strange creatures—you could try to determine which characteristics lead you in a fruitful direction. For example, you might plot the heights of a large sample of humans against their weights (which is a measure of their mass). Such a plot is shown in Figure 18.12 and it has some interesting features. In the way we have chosen to present our data, height increases upward, whereas weight increases to the left. Notice that humans are not randomly distributed in the graph. Most points fall along a sequence that goes from the upper left to the lower right.
英語のヒント
どのような関係が見つかりうるかを理解するため、人間についてのさまざまなデータを少し見てみよう。この奇妙な生き物についての予備知識を一切仮定せず、性質を比べて人間を理解したいなら、どの性質が有益な方向へ導くかを調べるだろう。たとえば、大勢の人の標本について、身長を、質量の指標である体重に対して描いてみるかもしれない。図18.12がそのグラフで、興味深い特徴がある。ここで選んだ示し方では、身長は上へ行くほど、体重は左へ行くほど増える。人間がグラフ上に無作為に散らばっているわけではないことに注目しよう。ほとんどの点は、左上から右下へ続く一つの列に沿っている。
Height versus Weight.身長と体重
OpenStax / Rice University · CC BY 4.0
Figure 18.12 The plot of the heights and weights of a representative group of human beings. Most points lie along a “main sequence” representing most people, but there are a few exceptions.
図18.12 人間を代表する一群について、身長と体重を描いたグラフ。ほとんどの点は、多くの人々を表す「主系列」に沿うが、少数の例外もある。
We can conclude from this graph that human height and weight are related. Generally speaking, taller human beings weigh more, whereas shorter ones weigh less. This makes sense if you are familiar with the structure of human beings. Typically, if we have bigger bones, we have more flesh to fill out our larger frame. It’s not mathematically exact—there is a wide range of variation—but it’s not a bad overall rule. And, of course, there are some dramatic exceptions. You occasionally see a short human who is very overweight and would thus be more to the bottom left of our diagram than the average sequence of people. Or you might have a very tall, skinny fashion model with great height but relatively small weight, who would be found near the upper right.
英語のヒント
このグラフから、人間の身長と体重には関係があると結論できる。一般に背の高い人は体重が重く、低い人は軽い。人間の構造を知っていれば、これは筋が通っている。通常、骨が大きければ、大きな骨格を埋める肉も多くなる。ばらつきの幅が広いため数学的に厳密ではないが、全体的な規則としては悪くない。もちろん、著しい例外もある。ときには、背は低いが体重が非常に重い人がいて、図の平均的な列より左下に来るだろう。また、非常に背が高く、細いファッションモデルなら、身長は高いが体重は比較的軽く、右上近くに位置するだろう。
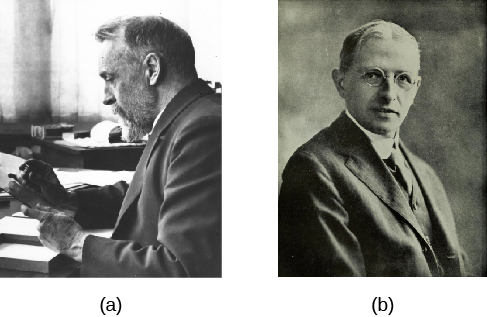
A similar diagram has been found extremely useful for understanding the lives of stars. In 1913, American astronomer Henry Norris Russell plotted the luminosities of stars against their spectral classes (a way of denoting their surface temperatures). This investigation, and a similar independent study in 1911 by Danish astronomer Ejnar Hertzsprung, led to the extremely important discovery that the temperature and luminosity of stars are related (Figure 18.13).
英語のヒント
似たような図が、恒星の一生を理解するのに極めて役立つことがわかった。1913年、アメリカの天文学者ヘンリー・ノリス・ラッセルは、恒星の光度を、表面温度を表すスペクトル型に対して描いた。この研究と、デンマークの天文学者アイナー・ヘルツシュプルングによる1911年の同様の独立した研究が、恒星の温度と光度には関係があるという、極めて重要な発見につながった(図18.13)。
Hertzsprung (1873–1967) and Russell (1877–1957).ヘルツシュプルング(1873–1967年)とラッセル(1877–1957年)
OpenStax / Rice University · CC BY 4.0
Figure 18.13 (a) Ejnar Hertzsprung and (b) Henry Norris Russell independently discovered the relationship between the luminosity and surface temperature of stars that is summarized in what is now called the H–R diagram.
図18.13 (a)アイナー・ヘルツシュプルングと(b)ヘンリー・ノリス・ラッセルは、現在H–R図と呼ばれる図にまとめられた、恒星の光度と表面温度の関係を、それぞれ独立に発見した。