第7章ほかの世界――太陽系入門Other Worlds: An Introduction to the Solar System
7.3 Dating Planetary Surfaces7.3 惑星表面の年代を測る
Learning Objectives学習の目標
By the end of this section, you will be able to:
この節を学び終えると、次のことができるようになる。
Explain how astronomers can tell whether a planetary surface is geologically young or old
惑星の表面が地質学的に若いか古いかを、天文学者がどのように判別するのか説明する。
Describe different methods for dating planets
惑星の年代を測る、さまざまな方法を説明する。
How do we know the age of the surfaces we see on planets and moons? If a world has a surface (as opposed to being mostly gas and liquid), astronomers have developed some techniques for estimating how long ago that surface solidified. Note that the age of these surfaces is not necessarily the age of the planet as a whole. On geologically active objects (including Earth), vast outpourings of molten rock or the erosive effects of water and ice, which we call planet weathering, have erased evidence of earlier epochs and present us with only a relatively young surface for investigation.
英語のヒント
惑星や衛星で見える表面の年代は、どうすればわかるのだろうか。天体が主に気体や液体でできているのではなく、表面を持っている場合、天文学者はいくつかの手法によって、その表面がどれほど前に固まったかを推定できる。ここでいう表面の年代は、必ずしも惑星全体の年齢ではないことに注意しよう。地球を含む地質学的に活発な天体では、溶けた岩石が大量に流れ出したり、水や氷が侵食したりする。惑星の風化と呼ばれるこうした作用が、以前の時代の証拠を消してしまい、私たちが調べられるのは、比較的若い表面だけになっている。
Counting the Cratersクレーターを数える
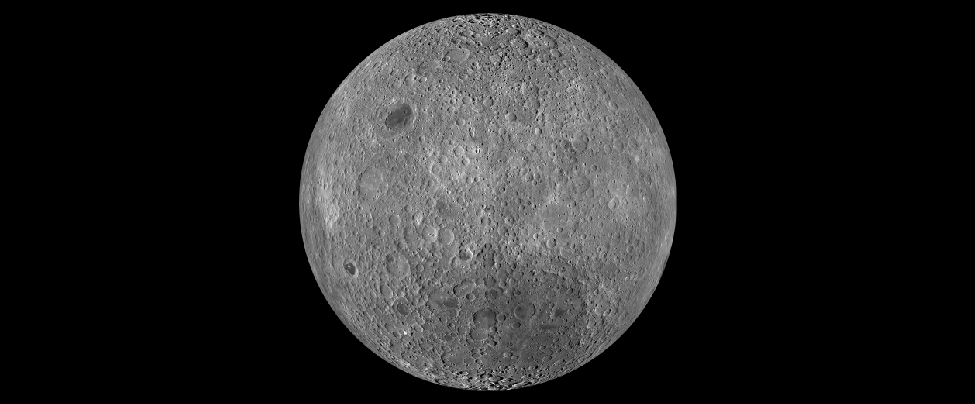
One way to estimate the age of a surface is by counting the number of impact craters. This technique works because the rate at which impacts have occurred in the solar system has been roughly constant for several billion years. Thus, in the absence of forces to eliminate craters, the number of craters is simply proportional to the length of time the surface has been exposed. This technique has been applied successfully to many solid planets and moons (Figure 7.15).
英語のヒント
表面の年代を推定する方法の一つは、衝突クレーターの数を数えることである。この手法が使えるのは、太陽系での衝突の頻度が、ここ数十億年間、おおむね一定だったからだ。したがって、クレーターを消し去る力が働かなければ、クレーターの数は、その表面が露出していた時間の長さに単純に比例する。この手法は、多くの固体の惑星や衛星に適用され、成果を上げている(図7.15)。
Our Cratered Moon.クレーターに覆われた私たちの月。
credit: modification of work by NASA/GSFC/Arizona State University · NASA media use guidelines
Figure 7.15 This composite image of the Moon’s surface was made from many smaller images taken between November 2009 and February 2011 by the Lunar Reconnaissance Orbiter (LRO) and shows craters of many different sizes. (credit: modification of work by NASA/GSFC/Arizona State University)
図7.15 月面のこの合成画像は、ルナー・リコネサンス・オービター(LRO)が2009年11月から2011年2月までに撮影した多数の小さな画像から作ったもので、さまざまな大きさのクレーターが写っている。(提供:NASA/GSFC/Arizona State Universityの作品を改変)
Bear in mind that crater counts can tell us only the time since the surface experienced a major change that could modify or erase preexisting craters. Estimating ages from crater counts is a little like walking along a sidewalk in a snowstorm after the snow has been falling steadily for a day or more. You may notice that in front of one house the snow is deep, while next door the sidewalk may be almost clear. Do you conclude that less snow has fallen in front of Ms. Jones’ house than Mr. Smith’s? More likely, you conclude that Jones has recently swept the walk clean and Smith has not. Similarly, the numbers of craters indicate how long it has been since a planetary surface was last “swept clean” by ongoing lava flows or by molten materials ejected when a large impact happened nearby.
英語のヒント
クレーター数からわかるのは、表面に大きな変化が起きて、以前からあったクレーターが変形したり消えたりしてからの時間だけだという点を、忘れないようにしよう。クレーターを数えて年代を推定するのは、一日以上ずっと雪が降り続いている吹雪の中で、歩道を歩くことに少し似ている。ある家の前には雪が深く積もっているのに、隣の家の前の歩道にはほとんど雪がないことに気付くかもしれない。そこで、ジョーンズさんの家の前はスミスさんの家の前より降雪が少なかった、と結論するだろうか。むしろ、ジョーンズさんは最近歩道の雪を掃き払ったが、スミスさんはそうしなかった、と考えるだろう。同様にクレーターの数が示すのは、流れ続ける溶岩や、近くで大衝突が起きた際に放出された溶融物によって、惑星表面が最後に「きれいに掃き払われて」から、どれほどの時間がたったかということである。
Still, astronomers can use the numbers of craters on different parts of the same world to provide important clues about how regions on that world evolved. On a given planet or moon, the more heavily cratered terrain will generally be older (that is, more time will have elapsed there since something swept the region clean).
英語のヒント
それでも天文学者は、同じ天体の異なる場所のクレーター数を使って、各領域がどのように変化してきたかについて、重要な手がかりを得られる。ある惑星や衛星の中では、クレーターの多い地形の方が一般に古い。つまり、何らかの作用がその領域をきれいに掃き払って以来、より長い時間がたっているのである。
Radioactive Rocks放射性物質を含む岩石
Another way to trace the history of a solid world is to measure the age of individual rocks. After samples were brought back from the Moon by Apollo astronauts, the techniques that had been developed to date rocks on Earth were applied to rock samples from the Moon to establish a geological chronology for the Moon. Furthermore, a few samples of material from the Moon, Mars, and the large asteroid Vesta have fallen to Earth as meteorites and can be examined directly (see the chapter on Cosmic Samples and the Origin of the Solar System).
英語のヒント
固体の世界の歴史をたどる、もう一つの方法は、個々の岩石の年代を測ることである。アポロの宇宙飛行士が月から試料を持ち帰った後、地球上の岩石の年代測定のために開発されていた手法が、月の岩石試料にも適用され、月の地質学的な年代の流れを明らかにした。さらに、月、火星、大きな小惑星ベスタに由来する物質の試料の一部は、隕石として地球に落ちてきており、直接調べられる(「宇宙からの試料と太陽系の起源」の章を参照)。
Scientists measure the age of rocks using the properties of natural radioactivity. Around the beginning of the twentieth century, physicists began to understand that some atomic nuclei are not stable but can split apart (decay) spontaneously into smaller nuclei. The process of radioactive decay involves the emission of particles such as electrons, or of radiation in the form of gamma rays (see the chapter on Radiation and Spectra).
英語のヒント
科学者は、自然界の放射能の性質を利用して、岩石の年代を測定する。20世紀初めごろ、物理学者は、原子核の中には不安定で、自発的に小さな原子核へ分裂する(崩壊する)ものがあると理解し始めた。放射性崩壊の過程では、電子などの粒子、またはガンマ線のような放射が放出される(「放射とスペクトル」の章を参照)。
For any one radioactive nucleus, it is not possible to predict when the decay process will happen. Such decay is random in nature, like the throw of dice: as gamblers have found all too often, it is impossible to say just when the dice will come up 7 or 11. But, for a very large number of dice tosses, we can calculate the odds that 7 or 11 will come up. Similarly, if we have a very large number of radioactive atoms of one type (say, uranium), there is a specific time period, called its half-life, during which the chances are fifty-fifty that decay will occur for any of the nuclei.
英語のヒント
放射性の原子核を一つ取り出しても、その崩壊がいつ起きるかを予測することはできない。このような崩壊は、本質的にサイコロ投げのようにランダムである。賭け事をする人が何度も思い知らされるように、サイコロで7や11がいつ出るかを正確に言うことは不可能だ。しかし、サイコロを非常に多くの回数投げるなら、7や11が出る確率を計算できる。同様に、ある一種類、例えばウランの放射性原子が非常に多数あれば、「半減期」と呼ばれる固有の時間が定まる。その時間の間に、どの原子核についても、崩壊が起きるかどうかの確率は五分五分になる。
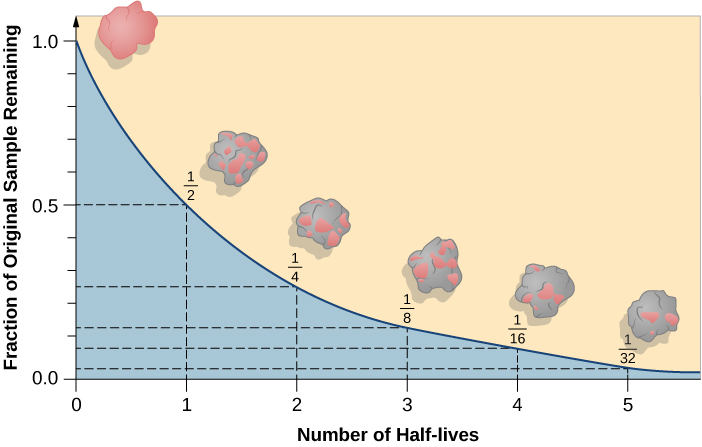
A particular nucleus may last a shorter or longer time than its half-life, but in a large sample, almost exactly half of the nuclei will have decayed after a time equal to one half-life. Half of the remaining nuclei will have decayed after two half-lives pass, leaving only one half of a half—or one quarter—of the original sample (Figure 7.16).
英語のヒント
一つの原子核が崩壊せずにいる時間は、半減期より短いことも長いこともある。しかし、大量の試料では、半減期一つ分の時間がたつと、原子核のほぼ正確に半分が崩壊している。半減期二つ分の時間がたつと、残っていた原子核の半分も崩壊し、もとの試料の半分の半分、すなわち4分の1だけが残る(図7.16)。
Radioactive Decay.放射性崩壊。
OpenStax / Rice University · CC BY 4.0
Figure 7.16 This graph shows (in pink) the amount of a radioactive sample that remains after several half-lives have passed. After one half-life, half the sample is left; after two half-lives, one half of the remainder (or one quarter) is left; and after three half-lives, one half of that (or one eighth) is left. Note that, in reality, the decay of radioactive elements in a rock sample would not cause any visible change in the appearance of the rock; the splashes of color are shown here for conceptual purposes only.
図7.16 このグラフは、半減期の何倍かの時間がたった後に残る、放射性試料の量をピンク色で示す。半減期一つ分の後には半分、二つ分の後には残りの半分(もとの4分の1)、三つ分の後にはさらにその半分(もとの8分の1)が残る。実際には、岩石試料中の放射性元素が崩壊しても、岩石の見た目に目に見える変化は起こらないことに注意しよう。ここで色分けしているのは、概念を示すためだけである。
If you had 1 gram of pure radioactive nuclei with a half-life of 100 years, then after 100 years you would have
1/2 gram; after 200 years, 1/4 gram; after 300 years, only 1/8 gram; and so forth. However, the material does not disappear. Instead, the radioactive atoms are replaced with their decay products. Sometimes the radioactive atoms are called parents and the decay products are called daughter elements.
英語のヒント
半減期100年の放射性原子核だけからなる物質が1 gあったとすると、100年後にはその原子核は1/2 g、200年後には1/4 g、300年後には1/8 gだけになる、といった具合に減っていく。ただし、物質そのものが消えるのではない。放射性原子は、崩壊生成物に置き換わるのである。放射性原子を親、崩壊生成物を娘元素と呼ぶこともある。
In this way, radioactive elements with half-lives we have determined can provide accurate nuclear clocks. By comparing how much of a radioactive parent element is left in a rock to how much of its daughter products have accumulated, we can learn how long the decay process has been going on and hence how long ago the rock formed. Table 7.3 summarizes the decay reactions used most often to date lunar and terrestrial rocks.
英語のヒント
このように、半減期が求められている放射性元素は、正確な原子核の時計として使える。岩石の中に放射性の親元素がどれだけ残っているかを、その崩壊による娘生成物がどれだけ蓄積しているかと比較すれば、崩壊がどれだけの間続いてきたか、したがって岩石がどれほど前に形成されたかがわかる。表7.3に、月や地球の岩石の年代測定に最もよく使われる崩壊反応をまとめた。
Radioactive Decay Reaction Used to Date RocksThe number after each element is its mass number, equal to the number of protons plus neutrons in its nucleus. This specifies the isotope of the element; different isotopes of the same element differ in the number of neutrons. 岩石の年代測定に用いられる放射性崩壊反応各元素の後の数字はその質量数で、原子核の中の陽子の数と中性子の数を足したものに等しい。この数字が、その元素の同位体を指定する。同じ元素の同位体同士は、中性子の数が異なる。 |
||
|---|---|---|
Parent 親核種 |
Daughter 娘核種 |
Half-Life (billions of years) 半減期(10億年) |
Samarium-147 サマリウム147 |
Neodymium-143 ネオジム143 |
106 |
Rubidium-87 ルビジウム87 |
Strontium-87 ストロンチウム87 |
48.8 |
Thorium-232 トリウム232 |
Lead-208 鉛208 |
14.0 |
Uranium-238 ウラン238 |
Lead-206 鉛206 |
4.47 |
Potassium-40 カリウム40 |
Argon-40 アルゴン40 |
1.31 |
When astronauts first flew to the Moon, one of their most important tasks was to bring back lunar rocks for radioactive age-dating. Until then, astronomers and geologists had no reliable way to measure the age of the lunar surface. Counting craters had let us calculate relative ages (for example, the heavily cratered lunar highlands were older than the dark lava plains), but scientists could not measure the actual age in years. Some thought that the ages were as young as those of Earth’s surface, which has been resurfaced by many geological events. For the Moon’s surface to be so young would imply active geology on our satellite. Only in 1969, when the first Apollo samples were dated, did we learn that the Moon is an ancient, geologically dead world. Using such dating techniques, we have been able to determine the ages of both Earth and the Moon: each was formed about 4.5 billion years ago (although, as we shall see, Earth probably formed earlier than the Moon).
英語のヒント
宇宙飛行士が初めて月へ飛んだとき、最も重要な仕事の一つは、放射性物質による年代測定のために、月の岩石を持ち帰ることだった。それまで、天文学者や地質学者には、月面の年代を測る信頼できる方法がなかった。クレーターを数えれば相対的な新旧は計算できた。例えば、クレーターの多い月の高地は、暗い溶岩平原より古い。しかし、実際に何年前なのかは測れなかった。度重なる地質学的な出来事によって表面が作り直されてきた地球と同じくらい、月の表面も若いと考える人もいた。もし月面がそれほど若ければ、月では地質活動が活発であることになる。最初のアポロ試料の年代が測定された1969年になって初めて、月は古く、地質学的には死んだ世界だとわかった。こうした年代測定の手法により、地球と月の両方の年齢を求めることができた。どちらも、形成されたのは約45億年前である(もっとも、後で見るように、地球はおそらく月より先に形成された)。
We should also note that the decay of radioactive nuclei generally releases energy in the form of heat. Although the energy from a single nucleus is not very large (in human terms), the enormous numbers of radioactive nuclei in a planet or moon (especially early in its existence) can be a significant source of internal energy for that world. Geologists estimate that about half of Earth’s current internal heat budget comes from the decay of radioactive isotopes in its interior.
英語のヒント
放射性原子核の崩壊は、一般に熱の形でエネルギーを放出することにも注意しておこう。原子核一つから出るエネルギーは、人間の尺度ではそれほど大きくない。しかし、惑星や衛星にある莫大な数の放射性原子核は、特にその天体が存在し始めた初期には、内部エネルギーの重要な供給源となりうる。地質学者は、現在の地球の内部熱収支のおよそ半分は、内部の放射性同位体の崩壊によるものだと推定している。