第17章星の光を分析するAnalyzing Starlight
17.3 The Spectra of Stars (and Brown Dwarfs)17.3 恒星と褐色矮星のスペクトル
Learning Objectives学習の目標
By the end of this section, you will be able to:
この節を読み終えたら、次のことができるようになる。
Describe how astronomers use spectral classes to characterize stars
スペクトル型を使って恒星の特徴を説明する。
Explain the difference between a star and a brown dwarf
恒星と褐色矮星の違いを説明する。
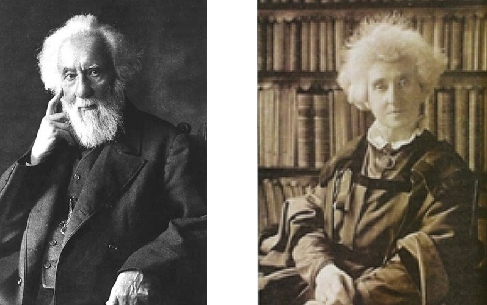
Measuring colors is only one way of analyzing starlight. Another way is to use a spectrograph to spread out the light into a spectrum (see the Radiation and Spectra and the Astronomical Instruments chapters). In 1814, the German physicist Joseph Fraunhofer observed that the spectrum of the Sun shows dark lines crossing a continuous band of colors. In the 1860s, English astronomers Sir William Huggins and Lady Margaret Huggins (Figure 17.4) succeeded in identifying some of the lines in stellar spectra as those of known elements on Earth, showing that the same chemical elements found in the Sun and planets exist in the stars. Since then, astronomers have worked hard to perfect experimental techniques for obtaining and measuring spectra, and they have developed a theoretical understanding of what can be learned from spectra. Today, spectroscopic analysis is one of the cornerstones of astronomical research.
英語のヒント
色を測ることは、星の光を分析する方法の一つにすぎない。もう一つの方法は、分光器で光を分け、スペクトルにすることだ。「放射とスペクトル」と「天文学の観測装置」の章を参照してほしい。1814年、ドイツの物理学者ヨーゼフ・フラウンホーファーは、太陽のスペクトルには連続した色の帯を横切る暗線があることを観測した。1860年代、イギリスの天文学者ウィリアム・ハギンズ卿とマーガレット・ハギンズ夫人(図17.4)は、恒星スペクトルの線の一部を、地球上で知られている元素の線と同定することに成功した。これによって、太陽や惑星にあるのと同じ化学元素が、恒星にも存在することが示された。その後、天文学者はスペクトルを取得し測定する実験技術の向上に努め、スペクトルから何を知りうるかについて、理論的な理解を深めてきた。今日、分光分析は天文学研究の基礎を支える柱の一つである。
William Huggins (1824–1910) and Margaret Huggins (1848–1915).ウィリアム・ハギンズ(1824–1910年)とマーガレット・ハギンズ(1848–1915年)
OpenStax / Rice University · CC BY 4.0
Figure 17.4 William and Margaret Huggins were the first to identify the lines in the spectrum of a star other than the Sun; they also took the first spectrogram, or photograph of a stellar spectrum.
英語のヒント
図17.4 ウィリアムとマーガレット・ハギンズは、太陽以外の恒星のスペクトルにある線を初めて同定した。また、恒星のスペクトルを初めて写真に記録した。
Formation of Stellar Spectra恒星スペクトルのでき方
When the spectra of different stars were first observed, astronomers found that they were not all identical. Since the dark lines are produced by the chemical elements present in the stars, astronomers first thought that the spectra differ from one another because stars are not all made of the same chemical elements. This hypothesis turned out to be wrong. The primary reason that stellar spectra look different is because the stars have different temperatures. Most stars have nearly the same composition as the Sun, with only a few exceptions.
英語のヒント
異なる恒星のスペクトルが初めて観測されたとき、天文学者は、それらがどれも同じではないと気づいた。暗線は恒星に含まれる化学元素によって生じるため、天文学者は当初、スペクトルが互いに異なるのは、恒星がどれも同じ元素からできているわけではないからだと考えた。この仮説は誤りだった。恒星のスペクトルが異なって見える主な理由は、星の温度が違うことにある。少数の例外を除けば、ほとんどの恒星は太陽とほぼ同じ組成をもつ。
Hydrogen, for example, is by far the most abundant element in most stars. However, lines of hydrogen are not seen in the spectra of the hottest and the coolest stars. In the atmospheres of the hottest stars, hydrogen atoms are completely ionized. Because the electron and the proton are separated, ionized hydrogen cannot produce absorption lines. (Recall from the Formation of Spectral Lines section, the lines are the result of electrons in orbit around a nucleus changing energy levels.)
英語のヒント
たとえば水素は、ほとんどの恒星で圧倒的に豊富な元素である。それなのに、最も高温の恒星と最も低温の恒星のスペクトルには、水素の線が見られない。最も高温の恒星の大気では、水素原子は完全に電離している。電子と陽子が離れているため、電離した水素は吸収線を作れない。「スペクトル線のでき方」の節で見たように、線は原子核のまわりの軌道にある電子がエネルギー準位を変えることで生じる。
In the atmospheres of the coolest stars, hydrogen atoms have their electrons attached and can switch energy levels to produce lines. However, practically all of the hydrogen atoms are in the lowest energy state (unexcited) in these stars and thus can absorb only those photons able to lift an electron from that first energy level to a higher level. Photons with enough energy to do this lie in the ultraviolet part of the electromagnetic spectrum, and there are very few ultraviolet photons in the radiation from a cool star. What this means is that if you observe the spectrum of a very hot or very cool star with a typical telescope on the surface of Earth, the most common element in that star, hydrogen, will show very weak spectral lines or none at all.
英語のヒント
最も低温の恒星の大気では、水素原子に電子が結びついており、エネルギー準位を変えて線を作ることができる。しかし、こうした恒星では、ほぼすべての水素原子が最も低いエネルギー状態、つまり励起されていない状態にある。そのため、最初のエネルギー準位からより高い準位へ電子を引き上げられる光子だけを吸収する。それに十分なエネルギーをもつ光子は、電磁スペクトルの紫外領域にある。低温の恒星からの放射には、紫外線の光子がごくわずかしか含まれない。つまり、地表にある普通の望遠鏡で、非常に高温または非常に低温の恒星のスペクトルを観測しても、その星で最も豊富な元素である水素のスペクトル線は非常に弱いか、まったく見られないのである。
The hydrogen lines in the visible part of the spectrum (called Balmer lines) are strongest in stars with intermediate temperatures—not too hot and not too cold. Calculations show that the optimum temperature for producing visible hydrogen lines is about 10,000 K. At this temperature, an appreciable number of hydrogen atoms are excited to the second energy level. They can then absorb additional photons, rise to still-higher levels of excitation, and produce a dark absorption line. Similarly, every other chemical element, in each of its possible stages of ionization, has a characteristic temperature at which it is most effective in producing absorption lines in any particular part of the spectrum.
英語のヒント
スペクトルの可視領域にある水素の線はバルマー線と呼ばれ、高すぎず低すぎない、中間の温度の恒星で最も強くなる。計算によると、可視領域の水素の線を生じさせるのに最適な温度は約10,000 Kである。この温度では、無視できない数の水素原子が第2のエネルギー準位まで励起されている。そうした原子はさらに光子を吸収して、いっそう高い励起準位へ移り、暗い吸収線を生じさせることができる。同様に、ほかのどの化学元素にも、取りうるそれぞれの電離段階について、スペクトルの特定の領域で最も効率よく吸収線を生じさせる、固有の温度がある。
Classification of Stellar Spectra恒星スペクトルの分類
Astronomers use the patterns of lines observed in stellar spectra to sort stars into a spectral class. Because a star’s temperature determines which absorption lines are present in its spectrum, these spectral classes are a measure of its surface temperature. There are seven standard spectral classes. From hottest to coldest, these seven spectral classes are designated O, B, A, F, G, K, and M. Recently, astronomers have added three additional classes for even cooler objects—L, T, and Y.
英語のヒント
天文学者は恒星スペクトルに見られる線のパターンを使い、恒星をスペクトル型に分類する。星の温度によって、そのスペクトルにどの吸収線が現れるかが決まるため、スペクトル型は表面温度の指標になる。標準的なスペクトル型は七つある。高温から低温へ順に、O、B、A、F、G、K、Mと名づけられている。最近では、さらに低温の天体に対し、L、T、Yという三つの型が追加された。
At this point, you may be looking at these letters with wonder and asking yourself why astronomers didn’t call the spectral types A, B, C, and so on. You will see, as we tell you the history, that it’s an instance where tradition won out over common sense.
英語のヒント
ここまで来ると、これらの文字を不思議に思い、なぜスペクトル型をA、B、C……と呼ばなかったのかと考えるかもしれない。これからその歴史を見れば、常識より伝統のほうが勝った例なのだとわかるだろう。
In the 1880s, Williamina Fleming devised a system to classify stars based on the strength of hydrogen absorption lines. Spectra with the strongest lines were classified as “A” stars, the next strongest “B,” and so on down the alphabet to “O” stars, in which the hydrogen lines were very weak. But we saw above that hydrogen lines alone are not a good indicator for classifying stars, since their lines disappear from the visible light spectrum when the stars get too hot or too cold.
英語のヒント
1880年代、ウィリアミナ・フレミングは、水素の吸収線の強さに基づく恒星分類の方式を考案した。最も線の強いスペクトルをもつ恒星を「A」、次に強いものを「B」とし、アルファベット順に、水素の線が非常に弱い「O」まで分類した。しかし先に見たように、水素の線だけでは恒星を分類するよい指標にはならない。恒星が高温すぎても低温すぎても、その線が可視光のスペクトルから消えてしまうからである。
In the 1890s, Annie Jump Cannon revised this classification system, focusing on just a few letters from the original system: A, B, F, G, K, M, and O. Instead of starting over, Cannon also rearranged the existing classes—in order of decreasing temperature—into the sequence we have learned: O, B, A, F, G, K, M. As you can read in the feature on Annie Cannon: Classifier of the Stars in this chapter, she classified around 500,000 stars over her lifetime, classifying up to three stars per minute by looking at the stellar spectra.
英語のヒント
1890年代、アニー・ジャンプ・キャノンは、この分類方式を改め、元の方式のうちA、B、F、G、K、M、Oという一部の文字だけに絞った。最初から作り直す代わりに、既存の型を温度の高い順に並べ直し、ここで学んだO、B、A、F、G、K、Mという順序にした。この章の特集「アニー・キャノン――星を分類した人」で紹介するように、彼女は生涯に約50万個の恒星を分類した。恒星スペクトルを見て、1分間に最大3個の速さで分類していた。
To help astronomers remember this crazy order of letters, Cannon created a mnemonic, “Oh Be A Fine Girl, Kiss Me.” (If you prefer, you can easily substitute “Guy” for “Girl.”) Other mnemonics, which we hope will not be relevant for you, include “Oh Brother, Astronomers Frequently Give Killer Midterms” and “Oh Boy, An F Grade Kills Me!” With the new L, T, and Y spectral classes, the mnemonic might be expanded to “Oh Be A Fine Girl (Guy), Kiss Me Like That, Yo!”
英語のヒント
この風変わりな文字の順序を天文学者が覚えやすいよう、キャノンは「Oh Be A Fine Girl, Kiss Me.」という語呂合わせを作った。「ああ、すてきな女の子になって、キスして」という意味で、各語の頭文字を並べるとO、B、A、F、G、K、Mになる。好みに応じてGirlをGuy(男の子)に替えてもよい。ほかにも、あなたには当てはまらないことを願いたいが、「Oh Brother, Astronomers Frequently Give Killer Midterms」(まったく、天文学者はしょっちゅうひどく難しい中間試験を出す)や「Oh Boy, An F Grade Kills Me!」(ああ、F評価なんて死にそうだ)という覚え方もある。新しいL、T、Yの型まで含めるなら、「Oh Be A Fine Girl (Guy), Kiss Me Like That, Yo!」(ああ、すてきな女の子〔男の子〕になって、そんなふうにキスしてくれよ)へ伸ばせる。
Each of these spectral classes, except possibly for the Y class which is still being defined, is further subdivided into 10 subclasses designated by the numbers 0 through 9. A B0 star is the hottest type of B star; a B9 star is the coolest type of B star and is only slightly hotter than an A0 star.
英語のヒント
これらのスペクトル型は、まだ定義が進められているY型を例外とする可能性はあるが、それぞれ0から9までの数字を付けた10の亜型にさらに分けられる。B0型はB型の中で最も高温であり、B9型はB型の中で最も低温で、A0型よりわずかに高温なだけである。
And just one more item of vocabulary: for historical reasons, astronomers call all the elements heavier than helium metals, even though most of them do not show metallic properties. (If you are getting annoyed at the peculiar jargon that astronomers use, just bear in mind that every field of human activity tends to develop its own specialized vocabulary. Just try reading a credit card or social media agreement form these days without training in law!)
英語のヒント
ここで、もう一つだけ用語を紹介しよう。歴史的な理由により、天文学者はヘリウムより重い元素をすべて金属と呼ぶ。その大部分が金属としての性質を示さなくても、そう呼ぶのである。天文学者の独特な専門用語にうんざりしてきたとしても、人間の活動のどの分野でも、独自の専門用語が発達しがちだと思い出してほしい。今どきのクレジットカードやソーシャルメディアの利用規約を、法律の知識なしで読んでみればわかるだろう。
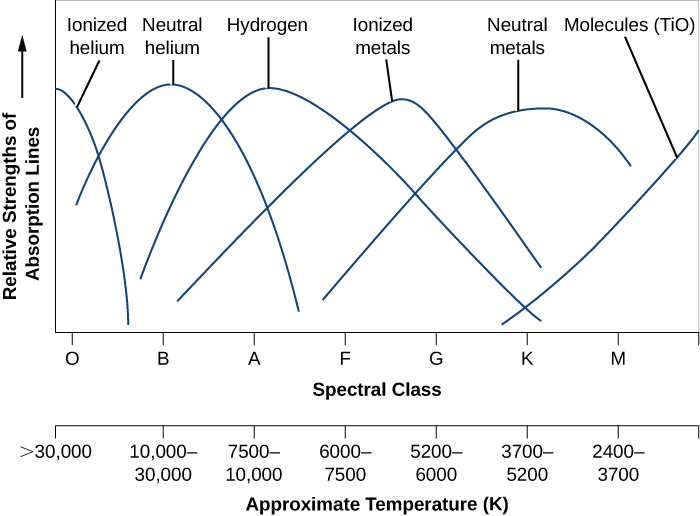
Let’s take a look at some of the details of how the spectra of the stars change with temperature. (It is these details that allowed Annie Cannon to identify the spectral types of stars as quickly as three per minute!) As Figure 17.5 shows, in the hottest O stars (those with temperatures over 28,000 K), only lines of ionized helium and highly ionized atoms of other elements are conspicuous. Hydrogen lines are strongest in A stars with atmospheric temperatures of about 10,000 K. Ionized metals provide the most conspicuous lines in stars with temperatures from 6000 to 7500 K (spectral type F). In the coolest M stars (below 3500 K), absorption bands of titanium oxide and other molecules are very strong. By the way, the spectral class assigned to the Sun is G2. The sequence of spectral classes is summarized in Table 17.2.
英語のヒント
温度によって恒星のスペクトルがどう変わるのか、もう少し詳しく見てみよう。こうした細部のおかげで、アニー・キャノンは1分間に3個という速さで恒星のスペクトル型を見分けられたのだ。図17.5に示すように、最も高温のO型星、つまり温度が28,000 Kを超える星では、電離したヘリウムと、ほかの元素の強く電離した原子の線だけが目立つ。水素の線が最も強いのは、大気温度が約10,000 KのA型星である。温度が6000〜7500 KのF型星では、電離した金属による線が最も目立つ。最も低温のM型星、すなわち3500 K未満の星では、酸化チタンなどの分子による吸収帯が非常に強い。なお、太陽に割り当てられているスペクトル型はG2である。スペクトル型の系列を表17.2にまとめた。
Absorption Lines in Stars of Different Temperatures.温度の異なる恒星の吸収線
OpenStax / Rice University · CC BY 4.0
Figure 17.5 This graph shows the strengths of absorption lines of different chemical species (atoms, ions, molecules) as we move from hot (left) to cool (right) stars. The sequence of spectral types is also shown.
図17.5 恒星の温度によって、さまざまな原子・イオン・分子による線の強さがどう変わるかを示す。最も高温の星が左、最も低温の星が右にあり、スペクトル型の順に並んでいる。
Spectral Classes for Stars 恒星のスペクトル型 |
||||
|---|---|---|---|---|
Spectral Class スペクトル型 |
Color 色 |
Approximate Temperature (K) おおよその温度(K) |
Principal Features 主な特徴 |
Examples 例 |
| O | Blue 青 |
> 30,000 30,000超 |
Neutral and ionized helium lines, weak hydrogen lines 電離していないヘリウムと電離ヘリウムの線、水素の線は弱い。 |
10 Lacertae とかげ座10番星 |
| B | Blue-white 青白 |
10,000–30,000 10,000〜30,000 |
Neutral helium lines, strong hydrogen lines 電離していないヘリウムの線、水素の線は強い。 |
Rigel, Spica リゲル、スピカ |
| A | White 白 |
7500–10,000 7500〜10,000 |
Strongest hydrogen lines, weak ionized calcium lines, weak ionized metal (e.g., iron, magnesium) lines 水素の線が最も強い。電離カルシウムの線は弱く、電離した金属(鉄、マグネシウムなど)の線も弱い。 |
Sirius, Vega シリウス、ベガ |
| F | Yellow-white 黄白 |
6000–7500 6000〜7500 |
Strong hydrogen lines, strong ionized calcium lines, weak sodium lines, many ionized metal lines 水素と電離カルシウムの線が強く、ナトリウムの線は弱い。電離した金属の線が多数ある。 |
Canopus, Procyon カノープス、プロキオン |
| G | Yellow 黄 |
5200–6000 5200〜6000 |
Weaker hydrogen lines, strong ionized calcium lines, strong sodium lines, many lines of ionized and neutral metals 水素の線が弱くなる。電離カルシウムとナトリウムの線が強く、電離した金属と電離していない金属の線が多数ある。 |
Sun, Capella 太陽、カペラ |
| K | Orange 橙 |
3700–5200 3700〜5200 |
Very weak hydrogen lines, strong ionized calcium lines, strong sodium lines, many lines of neutral metals 水素の線は非常に弱い。電離カルシウムとナトリウムの線が強く、電離していない金属の線が多数ある。 |
Arcturus, Aldebaran アークトゥルス、アルデバラン |
| M | Red 赤 |
2400–3700 2400〜3700 |
Strong lines of neutral metals and molecular bands of titanium oxide dominate 電離していない金属の強い線と、酸化チタン分子の吸収帯が卓越する。 |
Betelgeuse, Antares ベテルギウス、アンタレス |
| L | Red 赤 |
1300–2400 1300〜2400 |
Metal hydride lines, alkali metal lines (e.g., sodium, potassium, rubidium) 金属水素化物の線、アルカリ金属(ナトリウム、カリウム、ルビジウム)の線。 |
Teide 1 テイデ1 |
| T | Magenta 赤紫 |
700–1300 700〜1300 |
Methane lines メタンの線。 |
Gliese 229B グリーゼ229B |
| Y | InfraredAbsorption by sodium and potassium atoms makes Y dwarfs appear a bit less red than L dwarfs. 赤外。ナトリウム原子とカリウム原子による吸収のため、Y型矮星はL型矮星より少し赤みが弱く見える。 |
< 700 700未満 |
Ammonia lines アンモニアの線。 |
WISE 1828+2650 |
To see how spectral classification works, let’s use Figure 17.5. Suppose you have a spectrum in which the hydrogen lines are about half as strong as those seen in an A star. Looking at the lines in our figure, you see that the star could be either a B star or a G star. But if the spectrum also contains helium lines, then it is a B star, whereas if it contains lines of ionized iron and other metals, it must be a G star.
英語のヒント
スペクトルによる分類の仕組みを理解するため、図17.5を使ってみよう。水素の線の強さがA型星の約半分であるスペクトルが得られたとする。図の線を見ると、その星はB型星かG型星のどちらかだとわかる。しかし、そのスペクトルにヘリウムの線もあればB型星であり、電離した鉄などの金属の線があればG型星のはずである。
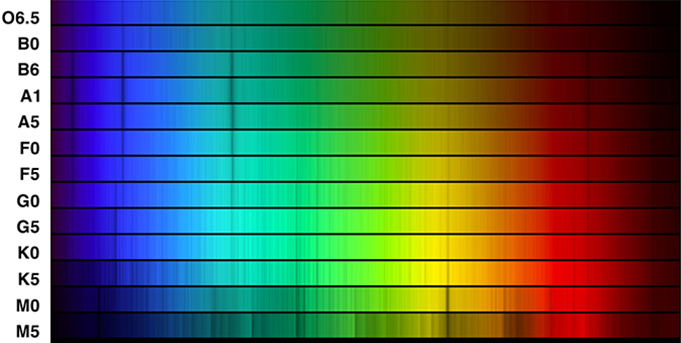
If you look at Figure 17.6, you can see that you, too, could assign a spectral class to a star whose type was not already known. All you have to do is match the pattern of spectral lines to a standard star (like the ones shown in the figure) whose type has already been determined.
英語のヒント
図17.6を見れば、まだ型がわかっていない恒星にも、自分でスペクトル型を割り当てられそうだとわかるだろう。必要なのは、スペクトル線のパターンを、図に示したような、すでに型が決まっている標準星のものに合わせることだけである。
Spectra of Stars with Different Spectral Classes.スペクトル型の異なる恒星のスペクトル
Credit: modification of work by NOAO/AURA/NSF · CC BY 4.0
Figure 17.6 This image compares the spectra of the different spectral classes. The spectral class assigned to each of these stellar spectra is listed at the left of the picture. The strongest four lines seen at spectral type A1 (one in the red, one in the blue-green, and two in the blue) are Balmer lines of hydrogen. Note how these lines weaken at both higher and lower temperatures, as Figure 17.5 also indicates. The strong pair of closely spaced lines in the yellow in the cool stars is due to neutral sodium (one of the neutral metals in Figure 17.5). (Credit: modification of work by NOAO/AURA/NSF)
図17.6 この画像は、異なるスペクトル型のスペクトルを比較している。それぞれに割り当てられたスペクトル型は、画像の左側に記されている。A1型で最も強い4本の線、すなわち赤に1本、青緑に1本、青に2本ある線は、水素のバルマー線である。図17.5でも示したように、これらの線は高温側でも低温側でも弱まることに注目しよう。低温の恒星の黄色い部分にある、間隔の狭い1対の強い線は、電離していないナトリウムによるものだ。これは図17.5の、電離していない金属の一つである。(提供:NOAO/AURA/NSFの画像を改変)
Both colors and spectral classes can be used to estimate the temperature of a star. Spectra are harder to measure because the light has to be bright enough to be spread out into all colors of the rainbow, and detectors must be sensitive enough to respond to individual wavelengths. In order to measure colors, the detectors need only respond to the many wavelengths that pass simultaneously through the colored filters that have been chosen—that is, to all the blue light or all the yellow-green light.
英語のヒント
色とスペクトル型は、どちらも星の温度の推定に使える。スペクトルのほうが測定は難しい。虹のすべての色に分けても測れるほど光が明るくなければならず、検出器には個々の波長に応答できる感度が必要だからである。色を測る場合、検出器は選んだ色フィルターを同時に通ってくる多数の波長、つまり青い光全体、または黄緑の光全体に応答すればよい。