第6章積分の応用
6.1 Areas between Curves6.1 曲線で囲まれた面積
Learning Objectives学習目標
- Determine the area of a region between two curves by integrating with respect to the independent variable.独立変数について積分し、二曲線間の領域の面積を求める。
- Find the area of a compound region.いくつかの部分に分かれる領域の面積を求める。
- Determine the area of a region between two curves by integrating with respect to the dependent variable.従属変数について積分し、二曲線間の領域の面積を求める。
In Introduction to Integration, we developed the concept of the definite integral to calculate the area below a curve on a given interval. In this section, we expand that idea to calculate the area of more complex regions. We start by finding the area between two curves that are functions of beginning with the simple case in which one function value is always greater than the other. We then look at cases when the graphs of the functions cross. Last, we consider how to calculate the area between two curves that are functions of
英語のヒント
「積分入門」では、指定区間で曲線の下の面積を計算するために、定積分の概念を導いた。この節では、その考えを広げて、より複雑な領域の面積を求める。まず、 の関数で表される二つの曲線の間の面積を、一方が常に他方より大きい場合から考える。次にグラフが交差する場合を扱い、最後に の関数として曲線を表す方法を調べる。
Area of a Region between Two Curves二つの曲線の間の領域の面積
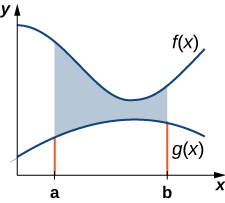
Let and be continuous functions over an interval such that on We want to find the area between the graphs of the functions, as shown in the following figure.
と を区間 上の連続関数とし、区間 上で が成り立つとする。次の図のように、二つのグラフに挟まれた面積を求めたい。
OpenStax, Rice University; Calculus Volume 1. · CC BY-NC-SA 4.0
Figure 6.2図 6.2
The area between the graphs of two functions, and on the interval
区間 上で、二つの関数 と のグラフに挟まれた領域。
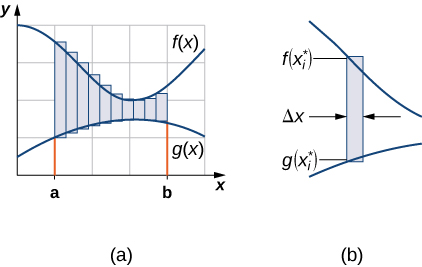
As we did before, we are going to partition the interval on the and approximate the area between the graphs of the functions with rectangles. So, for let be a regular partition of Then, for choose a point and on each interval construct a rectangle that extends vertically from to Figure 6.3(a) shows the rectangles when is selected to be the left endpoint of the interval and Figure 6.3(b) shows a representative rectangle in detail.
英語のヒント
OpenStax, Rice University; Calculus Volume 1. · CC BY-NC-SA 4.0
Figure 6.3図 6.3
(a)We can approximate the area between the graphs of two functions, and with rectangles. (b) The area of a typical rectangle goes from one curve to the other.
(a) 関数 と のグラフの間の面積を長方形で近似する。(b) 一つの長方形は、一方の曲線から他方の曲線まで伸びている。
The height of each individual rectangle is and the width of each rectangle is Adding the areas of all the rectangles, we see that the area between the curves is approximated by
各長方形の高さは 、幅は である。面積をすべて足し合わせると、二つの曲線の間の面積は次のように近似できる。
This is a Riemann sum, so we take the limit as and we get
これはリーマン和なので、 の極限をとると、
These findings are summarized in the following theorem.
以上の結果は、次の定理にまとめられる。
We apply this theorem in the following example.
次の例題で、この定理を使ってみよう。
Example 6.1例題 6.1
Finding the Area of a Region between Two Curves 1二つの曲線の間の面積を求める(1)
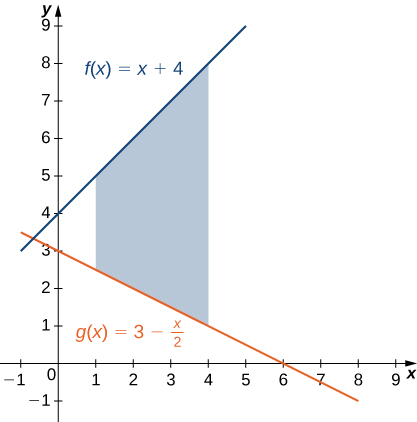
If R is the region bounded above by the graph of the function and below by the graph of the function over the interval find the area of region
区間 において、関数 のグラフを上側、 のグラフを下側とする領域 R を考える。 の面積を求めよ。
Solution解き方
The region is depicted in the following figure.
この領域を次の図に示す。
OpenStax, Rice University; Calculus Volume 1. · CC BY-NC-SA 4.0
Figure 6.4図 6.4
A region between two curves is shown where one curve is always greater than the other.
一方が常に他方より上にある、二つの曲線の間の領域。
We have
次の式が得られる。
The area of the region is
領域の面積は である。
In Example 6.1, we defined the interval of interest as part of the problem statement. Quite often, though, we want to define our interval of interest based on where the graphs of the two functions intersect. This is illustrated in the following example.
英語のヒント
例題6.1では、対象の区間が問題文に指定されていた。しかし、二つのグラフの交点から区間を定める場合も多い。次の例題で確認しよう。
Example 6.2例題 6.2
Finding the Area of a Region between Two Curves 2二つの曲線の間の面積を求める(2)
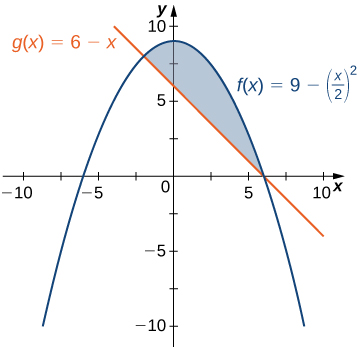
If is the region bounded above by the graph of the function and below by the graph of the function find the area of region
を、関数 のグラフを上側、 のグラフを下側とする領域とする。 の面積を求めよ。
Solution解き方
The region is depicted in the following figure.
この領域を次の図に示す。
OpenStax, Rice University; Calculus Volume 1. · CC BY-NC-SA 4.0
Figure 6.5図 6.5
This graph shows the region below the graph of and above the graph of
のグラフより下、 のグラフより上にある領域。
We first need to compute where the graphs of the functions intersect. Setting we get
まずグラフの交点を求める。 とおくと、
The graphs of the functions intersect when or so we want to integrate from to Since for we obtain
交点の x 座標は と なので、 から まで積分する。 では だから、
The area of the region is units2.
この領域の面積は 単位2である。