第3章微分
3.4 Derivatives as Rates of Change3.4 変化率としての導関数
Learning Objectives学習目標
- Determine a new value of a quantity from the old value and the amount of change.元の値と変化量から、新しい値を求める。
- Calculate the average rate of change and explain how it differs from the instantaneous rate of change.平均変化率を計算し、瞬間変化率との違いを説明する。
- Apply rates of change to displacement, velocity, and acceleration of an object moving along a straight line.変化率を、直線上を動く物体の変位・速度・加速度に適用する。
- Predict the future population from the present value and the population growth rate.現在の人口・個体数と増加率から、将来の規模を予測する。
- Use derivatives to calculate marginal cost and revenue in a business situation.導関数を使い、企業の限界費用と限界収入を計算する。
In this section we look at some applications of the derivative by focusing on the interpretation of the derivative as the rate of change of a function. These applications include acceleration and velocity in physics, population growth rates in biology, and marginal functions in economics.
英語のヒント
この節では、導関数を関数の変化率と捉えることに焦点を当て、いくつかの応用を学ぶ。物理学での加速度と速度、生物学での個体数の増加率、経済学での限界関数などがその例である。
Amount of Change Formula変化量を使った近似公式
One application for derivatives is to estimate an unknown value of a function at a point by using a known value of a function at some given point together with its rate of change at the given point. If is a function defined on an interval then the amount of change of over the interval is the change in the values of the function over that interval and is given by
英語のヒント
導関数の応用の1つは、ある点での関数値とその点での変化率を使い、近くの点での未知の関数値を推定することである。が区間で定義されているとする。この区間におけるの変化量は、区間の両端での関数のの値の差であり、次式で表される。
The average rate of change of the function over that same interval is the ratio of the amount of change over that interval to the corresponding change in the values. It is given by
同じ区間における関数の平均変化率は、この変化量を、それに対応するの値の変化量で割った比である。次式で表される。
As we already know, the instantaneous rate of change of at is its derivative
すでに学んだように、におけるの瞬間変化率は、微分係数
For small enough values of We can then solve for to get the amount of change formula:
hが十分小さければ、と近似できる。これをについて解くと、変化量を使った近似公式が得られる。
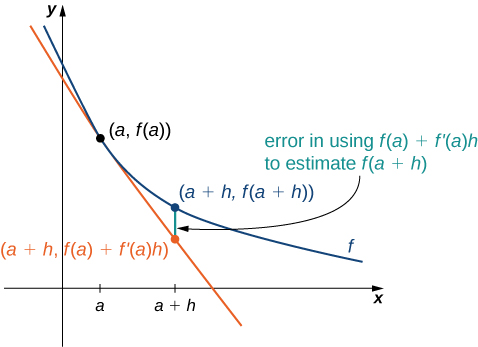
We can use this formula if we know only and and wish to estimate the value of For example, we may use the current population of a city and the rate at which it is growing to estimate its population in the near future. As we can see in Figure 3.22, we are approximating by the coordinate at on the line tangent to at Observe that the accuracy of this estimate depends on the value of as well as the value of
英語のヒント
この公式は、とがわかっていて、を推定したいときに使える。例えば、都市の現在の人口とその増加率から、近い将来の人口を推定できる。図3.22でわかるように、を、におけるの接線上で、横座標がとなる点の座標で近似している。この推定の精度は、の値だけでなくの値にも依存することに注意しよう。
OpenStax, Rice University; Calculus Volume 1. · CC BY-NC-SA 4.0
Figure 3.22図 3.22
The new value of a changed quantity equals the original value plus the rate of change times the interval of change:
変化後の値は、「元の値+変化率×変化させた幅」で近似できる。
Example 3.33例題 3.33
Estimating the Value of a Function関数の値を推定する
If and estimate
、のとき、を推定しなさい。
Solution解き方
Begin by finding We have Thus,
まずを求める。なので、
Motion along a Line直線上の運動
Another use for the derivative is to analyze motion along a line. We have described velocity as the rate of change of position. If we take the derivative of the velocity, we can find the acceleration, or the rate of change of velocity. It is also important to introduce the idea of speed, which is the magnitude of velocity. Thus, we can state the following mathematical definitions.
英語のヒント
導関数は、直線上の運動の解析にも使える。これまでに、速度は位置の変化率であると述べた。速度を微分すれば、速度の変化率である加速度が求まる。また、速度の大きさである「速さ」を区別して考えることも重要である。これらを数学的に次のように定義する。
Example 3.34例題 3.34
Comparing Instantaneous Velocity and Average Velocity瞬間速度と平均速度を比べる
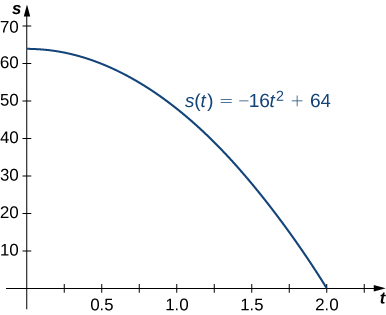
A ball is dropped from a height of 64 feet. Its height above ground (in feet) seconds later is given by
高さ64フィートからボールを落とす。秒後の地面からの高さを、フィート単位でと表す。
OpenStax, Rice University; Calculus Volume 1. · CC BY-NC-SA 4.0
- What is the instantaneous velocity of the ball when it hits the ground?ボールが地面に当たる瞬間の速度はいくらか。
- What is the average velocity during its fall?落下中の平均速度はいくらか。
Solution解き方
The first thing to do is determine how long it takes the ball to reach the ground. To do this, set Solving we get so it take 2 seconds for the ball to reach the ground.
まず、ボールが地面に達するまでの時間を求める。そのためにとおく。を解くとが得られるので、地面に達するまで2秒かかる。
- The instantaneous velocity of the ball as it strikes the ground is Since we obtainボールが地面に当たる瞬間の速度はである。なので、となる。
- The average velocity of the ball during its fall is落下中のボールの平均速度は、
Example 3.35例題 3.35
Interpreting the Relationship between and との関係を読み取る
A particle moves along a coordinate axis in the positive direction to the right. Its position at time is given by Find and and use these values to answer the following questions.
右向きを正とする座標軸上を質点が運動している。時刻の位置はで表される。とを求め、それらを使って次の問いに答えなさい。
- Is the particle moving from left to right or from right to left at time時刻で、質点は左から右へ動いているか、それとも右から左へ動いているか。
- Is the particle speeding up or slowing down at time時刻で、質点の速さは増しているか、それとも小さくなっているか。
Solution解き方
Begin by finding and
まずとを求める。
and
、およびである。
Evaluating these functions at we obtain and
を代入すると、、となる。
- Because the particle is moving from right to left.なので、質点は右から左へ動いている。
- Because and velocity and acceleration are acting in opposite directions. In other words, the particle is being accelerated in the direction opposite the direction in which it is traveling, causing to decrease. The particle is slowing down.かつなので、速度と加速度は逆向きである。つまり、進行方向と逆向きに加速され、が減少する。質点の速さは小さくなっている。
Example 3.36例題 3.36
Position and Velocity位置と速度
The position of a particle moving along a coordinate axis is given by
座標軸上を運動する質点の位置を、で表す。
- Findを求めなさい。
- At what time(s) is the particle at rest?質点が静止する時刻を求めなさい。
- On what time intervals is the particle moving from left to right? From right to left?左から右へ動く時間区間と、右から左へ動く時間区間を求めなさい。
- Use the information obtained to sketch the path of the particle along a coordinate axis.求めた情報を使い、座標軸上での質点の動きの概略を描きなさい。
Solution解き方
- The velocity is the derivative of the position function:速度は位置関数の導関数である。
- The particle is at rest when so set Factoring the left-hand side of the equation produces Solving, we find that the particle is at rest at andのときに質点は静止するので、とおく。左辺を因数分解するととなる。これを解くと、とで静止することがわかる。
- The particle is moving from left to right when and from right to left when Figure 3.23 gives the analysis of the sign of for but it does not represent the axis along which the particle is moving.のときは左から右へ、のときは右から左へ動く。図3.23はでのの符号を調べたものであり、質点が動く空間の座標軸を表しているわけではない。

OpenStax, Rice University; Calculus Volume 1. · CC BY-NC-SA 4.0
Figure 3.23図 3.23The sign of v(t) determines the direction of the particle.v(t)の符号が質点の進む向きを決める。
Since on the particle is moving from left to right on these intervals.
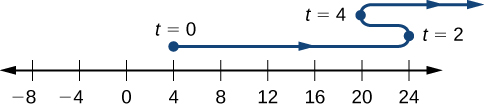
Since on the particle is moving from right to left on this interval.ではなので、これらの区間で質点は左から右へ動く。ではなので、この区間では右から左へ動く。 - Before we can sketch the graph of the particle, we need to know its position at the time it starts moving and at the times that it changes direction We have and This means that the particle begins on the coordinate axis at 4 and changes direction at 24 and 20 on the coordinate axis. The path of the particle is shown on a coordinate axis in Figure 3.24.質点の動きを描くには、動き始めの時刻と、向きが変わる時刻での位置を知る必要がある。、である。したがって質点は座標4から動き始め、座標24と20で向きを変える。図3.24に、その動きを座標軸上に示す。
OpenStax, Rice University; Calculus Volume 1. · CC BY-NC-SA 4.0
Figure 3.24図 3.24The path of the particle can be determined by analyzing v(t).v(t)を調べれば、質点の動きを決定できる。