プリンキピア

第3章微分

Higher-Order Derivatives高階導関数

The derivative of a function is itself a function, so we can find the derivative of a derivative. For example, the derivative of a position function is the rate of change of position, or velocity. The derivative of velocity is the rate of change of velocity, which is acceleration. The new function obtained by differentiating the derivative is called the second derivative. Furthermore, we can continue to take derivatives to obtain the third derivative, fourth derivative, and so on. Collectively, these are referred to as higher-order derivatives. The notation for the higher-order derivatives of y=f(x) can be expressed in any of the following forms:
英語のヒント
導関数も関数なので、導関数をさらに微分できる。たとえば、位置関数の導関数は位置の変化率、すなわち速度である。速度の導関数は速度の変化率、すなわち加速度となる。導関数をもう一度微分して得られる新しい関数を、2階導関数という。さらに微分を続ければ、第3次、第4次、というように導関数が得られる。これらをまとめて高階導関数と呼ぶ。y=f(x)の高階導関数は、次のいずれの記法でも表せる。
f″(x),f‴(x),f(4)(x),…,f(n)(x)
y″(x),y‴(x),y(4)(x),…,y(n)(x)
d2ydx2,d3ydx3,d4ydx4,…,dnydxn.
d2ydx2,d3ydx3,d4ydx4,…,dnydxn
It is interesting to note that the notation for d2ydx2 may be viewed as an attempt to express ddx(dydx) more compactly. Analogously, ddx(ddx(dydx))=ddx(d2ydx2)=d3ydx3.
英語のヒント
d2ydx2という記法は、ddx(dydx)をより簡潔に表そうとしたものと見ることができる。同様に、ddx(ddx(dydx))=ddx(d2ydx2)=d3ydx3である。
Example 3.15例題 3.15

Finding a Second Derivative2階導関数を求める

For f(x)=2x2−3x+1, find f″(x).
f(x)=2x2−3x+1について、f″(x)を求めなさい。
Solution解き方
First find f′(x).
まずf′(x)を求める。
f′(x)=limh→0(2(x+h)2−3(x+h)+1)−(2x2−3x+1)hSubstitutef(x)=2x2−3x+1andf(x+h)=2(x+h)2−3(x+h)+1intof′(x)=limh→0f(x+h)−f(x)h.=limh→04xh+2h2−3hhSimplify the numerator.=limh→0(4x+2h−3)Factor out thehin the numeratorand cancel with thehin thedenominator.=4x−3Take the limit.
f′(x)=limh→0(2(x+h)2−3(x+h)+1)−(2x2−3x+1)h代入する値:f(x)=2x2−3x+1およびf(x+h)=2(x+h)2−3(x+h)+1代入先:f′(x)=limh→0f(x+h)−f(x)h.=limh→04xh+2h2−3hh分子を整理する。=limh→0(4x+2h−3)分子からhをくくり出し、分母のhと約分する。=4x−3極限をとる。
Next, find f″(x) by taking the derivative of f′(x)=4x−3.
次に、f′(x)=4x−3を微分してf″(x)を求める。
f″(x)=limh→0f′(x+h)−f′(x)hUsef′(x)=limh→0f(x+h)−f(x)hwithf′(x)inplace off(x).=limh→0(4(x+h)−3)−(4x−3)hSubstitutef′(x+h)=4(x+h)−3andf′(x)=4x−3.=limh→04Simplify.=4Take the limit.
f″(x)=limh→0f′(x+h)−f′(x)h導関数の定義 f′(x)=lim[h→0](f(x+h)−f(x))/h を用い、fの代わりにf′を微分する。=limh→0(4(x+h)−3)−(4x−3)h代入する値:f′(x+h)=4(x+h)−3およびf′(x)=4x−3.=limh→04整理する。=4極限をとる。
Example 3.16例題 3.16

Finding Acceleration加速度を求める

The position of a particle along a coordinate axis at time t (in seconds) is given by s(t)=3t2−4t+1 (in meters). Find the function that describes its acceleration at time t.
座標軸に沿って動く粒子の、時刻t秒における位置をs(t)=3t2−4t+1メートルとする。時刻tでの加速度を表す関数を求めなさい。
Solution解き方
Since v(t)=s′(t) and a(t)=v′(t)=s″(t), we begin by finding the derivative of s(t):
v(t)=s′(t)かつa(t)=v′(t)=s″(t)なので、まずs(t)の導関数を求める。
s′(t)=limh→0s(t+h)−s(t)h=limh→03(t+h)2−4(t+h)+1−(3t2−4t+1)h=6t−4.
Next,
次に、
s″(t)=limh→0s′(t+h)−s′(t)h=limh→06(t+h)−4−(6t−4)h=6.
Thus, a=6m/s2.
したがって、a=6m/s2である。

Key Concepts重要な概念

  • The derivative of a function f(x) is the function whose value at x is f′(x).
    関数f(x)の導関数とは、xに対してf′(x)という値を与える関数である。
  • The graph of a derivative of a function f(x) is related to the graph of f(x). Where f(x) has a tangent line with positive slope, f′(x)>0. Where f(x) has a tangent line with negative slope, f′(x)<0. Where f(x) has a horizontal tangent line, f′(x)=0.
    関数f(x)の導関数のグラフは、f(x)のグラフと関連している。f(x)の接線の傾きが正ならf′(x)>0、f(x)の接線の傾きが負ならf′(x)<0となる。f(x)の接線が水平ならf′(x)=0である。
  • If a function is differentiable at a point, then it is continuous at that point. A function is not differentiable at a point if it is not continuous at the point, if it has a vertical tangent line at the point, or if the graph has a sharp corner or cusp.
    ある点で微分可能なら、関数はその点で連続である。その点で連続でない場合、鉛直な接線をもつ場合、グラフに鋭い角や尖点がある場合には、微分できない。
  • Higher-order derivatives are derivatives of derivatives, from the second derivative to the nth derivative.
    高階導関数とは、導関数をさらに微分して得る、第2次から第n次までの導関数である。

Key Equations重要な式

The derivative function
導関数
f′(x)=limh→0f(x+h)−f(x)h
Exercises 54–63練習問題 54–63
For the following exercises, use the definition of a derivative to find f′(x).
次の問題では、導関数の定義を使ってf′(x)を求めなさい。
Exercise 54問題 54
f(x)=6
f(x)=6
Exercise 55問題 55
f(x)=2−3x
f(x)=2−3x
Solution解き方
−3
−3
Exercise 56問題 56
f(x)=2x7+1
f(x)=2x7+1
Exercise 57問題 57
f(x)=4x2
f(x)=4x2
Solution解き方
8x
8x
Exercise 58問題 58
f(x)=5x−x2
f(x)=5x−x2
Exercise 59問題 59
f(x)=2x
f(x)=2x
Solution解き方
12x
12x
Exercise 60問題 60
f(x)=x−6
f(x)=x−6
Exercise 61問題 61
f(x)=9x
f(x)=9x
Solution解き方
−9x2
−9x2
Exercise 62問題 62
f(x)=x+1x
f(x)=x+1x
Exercise 63問題 63
f(x)=1x
f(x)=1x
Solution解き方
−12x3/2
−12x3/2
Exercises 64–67練習問題 64–67
For the following exercises, use the graph of y=f(x) to sketch the graph of its derivative f′(x).
次の問題では、y=f(x)のグラフを使い、導関数f′(x)のグラフの概形を描きなさい。
Exercise 64問題 64
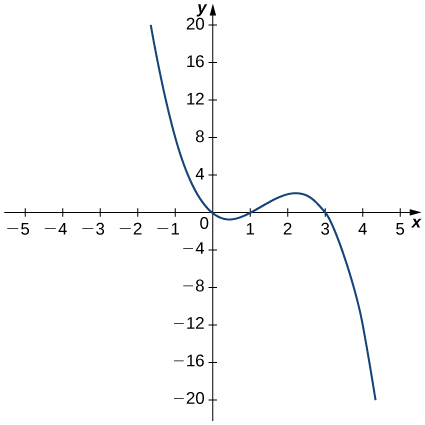
関数f(x)は(−2,20)から減少し、原点を通っておよそ(0.5,−1)で極小となる。そこから増加し、(1,0)を通って(2.25,2)で極大となる。その後は再び減少し、(3,0)を通って(4,−20)へ伸びる。

OpenStax, Rice University; Calculus Volume 1. · CC BY-NC-SA 4.0

Exercise 65問題 65
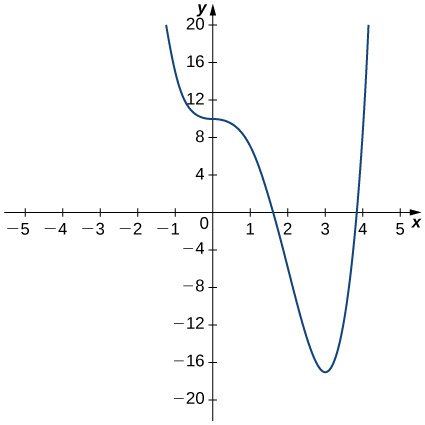
関数f(x)は(−1.5,20)から減少し、(0,10)を通る。この点では微分係数が0に見える。その後も減少して(1.7,0)を通り、(3,−17)で最小となる。そこから急に増加し、(3.8,0)を通って(4,20)へ伸びる。

OpenStax, Rice University; Calculus Volume 1. · CC BY-NC-SA 4.0

Solution解き方
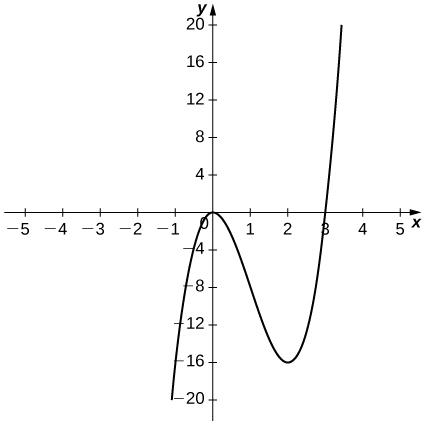
曲線は第3象限から増加して原点に接する。その後減少して(2,−16)で最小となり、再び増加する。x=3でx軸を横切った後も増加し続ける。

OpenStax, Rice University; Calculus Volume 1. · CC BY-NC-SA 4.0

Exercise 66問題 66
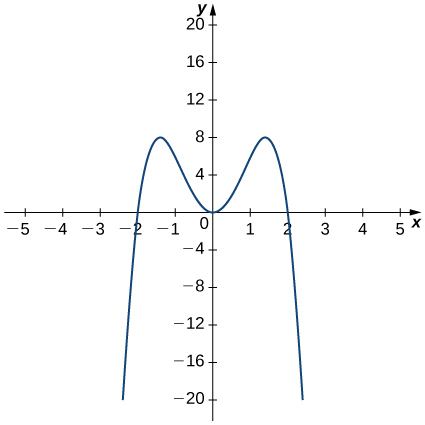
関数f(x)は(−2.25,−20)から急に増加し、(−2,0)を通って(−1.4,8)で極大となる。その後、原点まで減少する。グラフはy軸について対称であり、そこから(1.4,8)まで増加した後、(2,0)を通って(2.25,−20)へ減少する。

OpenStax, Rice University; Calculus Volume 1. · CC BY-NC-SA 4.0

Exercise 67問題 67
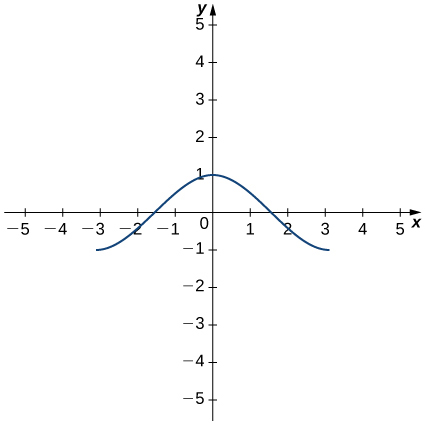
曲線は(−3,−1)付近から増加し、およそ(−1.5,0)を通って(0,1)で最大となる。その後減少し、およそ(1.5,0)を通って(3,−1)付近へ伸びる。

OpenStax, Rice University; Calculus Volume 1. · CC BY-NC-SA 4.0

Solution解き方
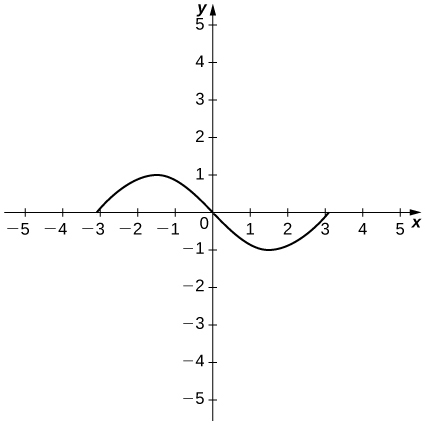
曲線は(−3,0)から増加して(−1.5,1)で最大となり、原点を通って(1.5,−1)まで減少する。その後増加し、x=3でx軸に達する。

OpenStax, Rice University; Calculus Volume 1. · CC BY-NC-SA 4.0

Exercises 68–73練習問題 68–73
For the following exercises, the given limit represents the derivative of a function y=f(x) at x=a. Find f(x) and a.
次の各極限は、関数y=f(x)のx=aにおける微分係数を表している。f(x)とaを求めなさい。
Exercise 68問題 68
limh→0(1+h)2/3−1h
limh→0(1+h)2/3−1h
Exercise 69問題 69
limh→0[3(2+h)2+2]−14h
Solution解き方
f(x)=3x2+2,a=2
f(x)=3x2+2,a=2
Exercise 70問題 70
limh→0cos(π+h)+1h
limh→0cos(π+h)+1h
Exercise 71問題 71
limh→0(2+h)4−16h
limh→0(2+h)4−16h
Solution解き方
f(x)=x4,a=2
f(x)=x4,a=2
Exercise 72問題 72
limh→0[2(3+h)2−(3+h)]−15h
Exercise 73問題 73
limh→0eh−1h
limh→0eh−1h
Solution解き方
f(x)=ex,a=0
f(x)=ex,a=0
Exercises 74–77練習問題 74–77
For the following functions,
次の各関数について、以下を行いなさい。
  1. sketch the graph and
    グラフの概形を描く。
  2. use the definition of a derivative to show that the function is not differentiable at x=1.
    微分係数の定義を使い、この関数がx=1で微分可能でないことを示す。
Exercise 74問題 74
f(x)={2x,0≤x≤13x−1,x>1
Exercise 75問題 75
f(x)={3,x<13x,x≥1
f(x)={3,x<13x,x≥1
Solution解き方
a.
a.
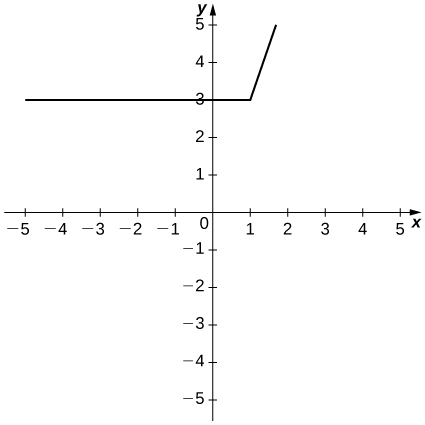
グラフは(1,3)まではy=3の水平線であり、その点から先は傾き3の直線として増加する。

OpenStax, Rice University; Calculus Volume 1. · CC BY-NC-SA 4.0


b. limh→1−3−3h≠limh→1+3hh
Exercise 76問題 76
f(x)={−x2+2,x≤1x,x>1
Exercise 77問題 77
f(x)={2x,x≤12x,x>1
f(x)={2x,x≤12x,x>1
Solution解き方
a.
a.
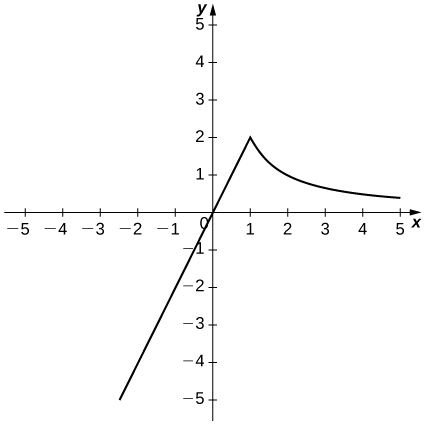
グラフは第3象限から傾き2の直線として原点を通り、(1,2)に達する。その先はy=2/xの曲線に沿い、下に凸の形で減少する。

OpenStax, Rice University; Calculus Volume 1. · CC BY-NC-SA 4.0


b. limh→1−2hh≠limh→1+2x+h−2xh.
b. limh→1−2hh≠limh→1+2x+h−2xh
Exercises 78–80練習問題 78–80
For the following graphs,
次の各グラフについて、以下を調べなさい。
  1. determine for which values of x=a the limx→af(x) exists but f is not continuous at x=a, and
    limx→af(x)は存在するが、fがx=aで連続でないのは、どのx=aの値かを求める。
  2. determine for which values of x=a the function is continuous but not differentiable at x=a.
    関数がx=aで連続だが微分可能でないのは、どのx=aの値かを求める。
Exercise 78問題 78
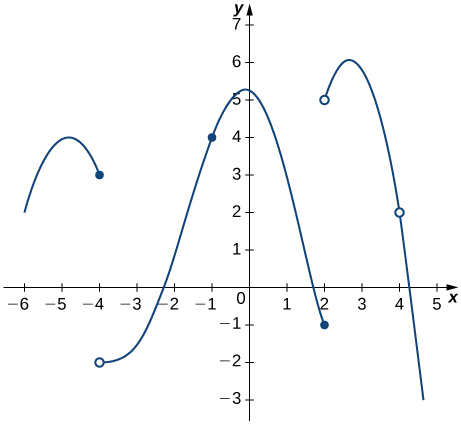
グラフは(−6,2)から増加し、(−5.3,4)付近で極大となった後、端点を含む(−4,3)まで伸びる。次の部分は(−4,−2)から始まり、ゆっくり増加して(−2.25,0)、(−1,4)を通り、(−0.1,5.3)付近で極大となる。その後は減少し、端点を含む(2,−1)まで伸びる。 さらに(2,5)から始まる部分は、(2.6,6)まで増加し、(4.5,−3)まで減少する。(4,2)のところに不連続がある。

OpenStax, Rice University; Calculus Volume 1. · CC BY-NC-SA 4.0

Exercise 79問題 79
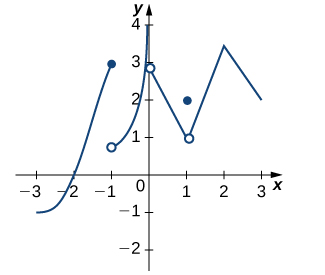
グラフは(−3,−1)から増加し、端点を含む(−1,3)で終わる。次の部分は(−1,1)から始まり、急に増加して、端点を含む(0,4)で終わる。 さらに(0,3)から始まり、(1,1)まで直線的に減少する。ただしx=1では不連続で、関数値は2である。その先は(1,1)から(2,3.5)まで直線的に増加し、そこから(3,2)まで直線的に減少する。

OpenStax, Rice University; Calculus Volume 1. · CC BY-NC-SA 4.0

Solution解き方
a. x=1, b. x=2
a. x=1 b. x=2
Exercise 80問題 80
Use the graph to evaluate a. f′(−0.5), b. f′(0), c. f′(1), d. f′(2), and e. f′(3), if it exists.
グラフを使い、(a) f′(−0.5)、(b) f′(0)、(c) f′(1)、(d) f′(2)、(e) f′(3)を、それぞれ存在する場合に求めなさい。
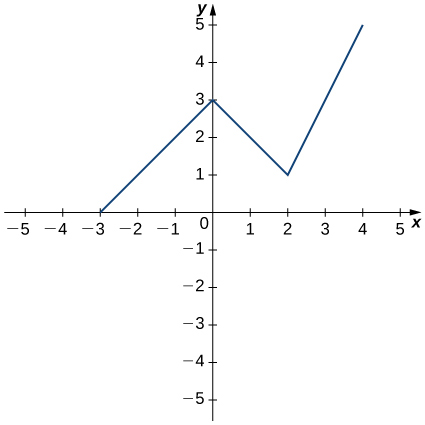
グラフは(−3,0)から(0,3)まで直線的に増加し、そこで極大となる。その後、(2,1)まで直線的に減少し、そこから(4,5)まで直線的に増加する。

OpenStax, Rice University; Calculus Volume 1. · CC BY-NC-SA 4.0

Exercises 81–83練習問題 81–83
For the following functions, use f″(x)=limh→0f′(x+h)−f′(x)h to find f″(x).
次の関数について、f″(x)=limh→0f′(x+h)−f′(x)hを使ってf″(x)を求めなさい。
Exercise 81問題 81
f(x)=2−3x
f(x)=2−3x
Solution解き方
0
0
Exercise 82問題 82
f(x)=4x2
f(x)=4x2
Exercise 83問題 83
f(x)=x+1x
f(x)=x+1x
Solution解き方
2x3
2x3
Exercises 84–89練習問題 84–89
For the following exercises, use a calculator to graph f(x). Determine the function f′(x), then use a calculator to graph f′(x).
次の問題では、電卓を使ってf(x)のグラフを描きなさい。導関数f′(x)を求め、次に電卓を使ってf′(x)のグラフを描きなさい。
Exercise 84問題 84
[T] f(x)=−5x
[T] f(x)=−5x
Exercise 85問題 85
[T] f(x)=3x2+2x+4.
[T] f(x)=3x2+2x+4
Solution解き方
f′(x)=6x+2
f′(x)=6x+2
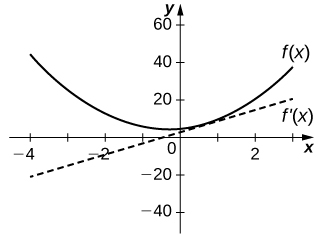
f(x)のグラフは、y切片が4で上向きに開く放物線。f′(x)のグラフは、y切片が2、傾きが6の直線である。

OpenStax, Rice University; Calculus Volume 1. · CC BY-NC-SA 4.0

Exercise 86問題 86
[T] f(x)=x+3x
[T] f(x)=x+3x
Exercise 87問題 87
[T] f(x)=12x
[T] f(x)=12x
Solution解き方
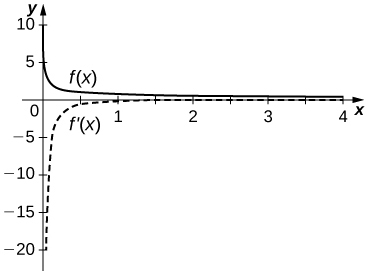
f′(x)=−1(2x)3/2
f′(x)=−1(2x)3/2
f(x)のグラフは第1象限にあり、x=0とy=0を漸近線とする。f′(x)のグラフは第4象限にあり、同じくx=0とy=0を漸近線とする。

OpenStax, Rice University; Calculus Volume 1. · CC BY-NC-SA 4.0

Exercise 88問題 88
[T] f(x)=1+x+1x
[T] f(x)=1+x+1x
Exercise 89問題 89
[T] f(x)=x3+1
[T] f(x)=x3+1
Solution解き方
f′(x)=3x2
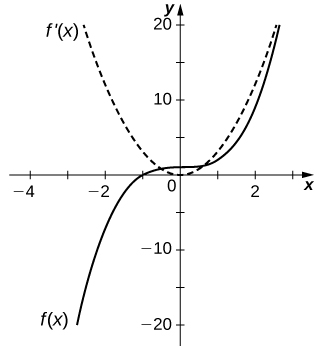
f′(x)=3x2
f(x)は、三乗の関数のグラフを上へ1だけ平行移動したもの。f′(x)は、通常の二乗の関数よりやや急に立ち上がる放物線である。

OpenStax, Rice University; Calculus Volume 1. · CC BY-NC-SA 4.0

Exercises 90–99練習問題 90–99
For the following exercises, describe what the two expressions represent in terms of each of the given situations. Be sure to include units.
次の各状況について、二つの式が何を表すか説明しなさい。必ず単位も示すこと。
  1. f(x+h)−f(x)h
    f(x+h)−f(x)h
  2. f′(x)=limh→0f(x+h)−f(x)h
    f′(x)=limh→0f(x+h)−f(x)h
Exercise 90問題 90
P(x) denotes the population of a city at time x in years.
P(x)は、年を単位とする時刻xにおける都市の人口を表す。
Exercise 91問題 91
C(x) denotes the total amount of money (in thousands of dollars) spent on concessions by x customers at an amusement park.
C(x)は、遊園地の客x人が売店で使う金額の総額を、千ドル単位で表す。
Solution解き方
a. Average rate at which customers spent on concessions in thousands per customer. b. Rate (in thousands per customer) at which x customers spent money on concessions in thousands per customer.
(a) 客数が変わる区間での、売店で使う総額の平均変化率。単位は千ドル/人。 (b) 客数がx人のときの、売店で使う総額の変化率。単位は同じく千ドル/人。
Exercise 92問題 92
R(x) denotes the total cost (in thousands of dollars) of manufacturing x clock radios.
R(x)は、時計付きラジオをx台製造する総費用を、千ドル単位で表す。
Exercise 93問題 93
g(x) denotes the grade (in percentage points) received on a test, given x hours of studying.
g(x)は、x時間勉強したときの試験の得点率を、パーセントポイントで表す。
Solution解き方
a. Average grade received on the test with an average study time between two values. b. Rate (in percentage points per hour) at which the grade on the test increased or decreased for a given average study time of x hours.
(a) 二つの勉強時間の間での得点率の平均変化率。 (b) 勉強時間がx時間のときに、試験の得点率が増減する割合。単位はパーセントポイント/時間。
Exercise 94問題 94
B(x) denotes the cost (in dollars) of a sociology textbook at university bookstores in the United States in x years since 1990.
B(x)は、1990.年からx年後に、米国の大学の書店で販売される社会学の教科書の価格を、ドル単位で表す。
Exercise 95問題 95
p(x) denotes atmospheric pressure in Torrs at an altitude of x feet.
p(x)は、高度xフィートにおける大気圧をTorr単位で表す。
Solution解き方
a. Average change of atmospheric pressure between two different altitudes. b. Rate (torr per foot) at which atmospheric pressure is increasing or decreasing at x feet.
(a) 二つの高度の間での、大気圧の平均変化率。 (b) 高度xフィートにおいて大気圧が増減する割合。単位はTorr/フィート。
Exercise 96問題 96
Sketch the graph of a function y=f(x) with all of the following properties:
次の性質をすべて満たす関数y=f(x)のグラフの概形を描きなさい。
  1. f′(x)>0 for −2≤x<1
    −2≤x<1ではf′(x)>0。
  2. f′(2)=0
    f′(2)=0
  3. f′(x)>0 for x>2
    x>2ではf′(x)>0。
  4. f(2)=2 and f(0)=1
    f(2)=2かつf(0)=1。
  5. limx→−∞f(x)=0 and limx→∞f(x)=∞
    limx→−∞f(x)=0かつlimx→∞f(x)=∞。
  6. f′(1) does not exist.
    f′(1)は存在しない。
Exercise 97問題 97
Suppose temperature T in degrees Fahrenheit at a height x in feet above the ground is given by y=T(x).
地面からの高さxフィートにおける華氏温度Tが、y=T(x)で与えられるとする。
  1. Give a physical interpretation, with units, of T′(x).
    T′(x)の物理的な意味を、単位も含めて説明する。
  2. If we know that T′(1000)=−0.1, explain the physical meaning.
    T′(1000)=−0.1であると分かっているとき、その物理的な意味を説明する。
Solution解き方
a. The rate (in degrees per foot) at which temperature is increasing or decreasing for a given height x. b. The rate of change of temperature as altitude changes at 1000 feet is −0.1 degrees per foot.
(a) 高さxにおいて、温度が増減する割合。単位は華氏度/フィート。 (b) 高度1000フィートで、高度の変化に対する温度の変化率は、1フィート当たり−0.1度である。
Exercise 98問題 98
Suppose the total profit of a company is y=P(x) thousand dollars when x units of an item are sold.
ある商品がx個売れたとき、会社の総利益はy=P(x)千ドルになるとする。
  1. What does P(b)−P(a)b−a for 0<a<b measure, and what are the units?
    0<a<bに対して、P(b)−P(a)b−aは何を測っているか。単位も示す。
  2. What does P′(x) measure, and what are the units?
    P′(x)は何を測っているか。単位も示す。
  3. Suppose that P′(30)=5, what is the approximate change in profit if the number of items sold increases from 30to31?
    P′(30)=5とする。販売個数が30から31へ増えたとき、利益はおよそいくら変わるか。
Exercise 99問題 99
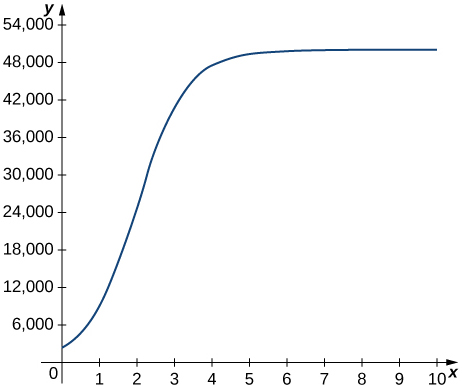
The graph in the following figure models the number of people N(t) who have come down with the flu t weeks after its initial outbreak in a town with a population of 50,000 citizens.
英語のヒント
次のグラフは、人口50,000人の町で、インフルエンザが最初に発生してからt週間後までに罹患した人数N(t)を表すモデルである。
  1. Describe what N′(t) represents and how it behaves as t increases.
    N′(t)が何を表すか、またtが増えるとどう変わるかを説明する。
  2. What does the derivative tell us about how this town is affected by the flu outbreak?
    この町へのインフルエンザ流行の影響について、導関数から何が分かるか。
グラフは(0,3000)から急に増加し、水平な漸近線y=50000に近づく。

OpenStax, Rice University; Calculus Volume 1. · CC BY-NC-SA 4.0

Solution解き方
a. The rate at which the number of people who have come down with the flu is changing t weeks after the initial outbreak. b. The rate is increasing sharply up to the third week, at which point it slows down and then becomes constant.
a. 最初の発生からt週間後に、罹患者数が増える割合を表す。図では、この割合は初め大きくなり、第2週付近を境に小さくなって、やがて0に近づく。b. 最初は感染拡大が勢いを増すが、その後は新たに罹患する人数が減っていく。累計の罹患者数は減らず、およそ50,000人に近づく。