第3章微分
Exercises 167–168練習問題 167–168
The following questions concern the population (in millions) of London by decade in the 19th century, which is listed in the following table.
次の問題では、19世紀のロンドンの人口を扱う。10年ごとの人口を、百万人単位で次の表に示す。
Years since 1800 1800年からの経過年数 |
Population (millions) 人口(百万人) |
|---|---|
1 |
0.8795 |
11 |
1.040 |
21 |
1.264 |
31 |
1.516 |
41 |
1.661 |
51 |
2.000 |
61 |
2.634 |
71 |
3.272 |
81 |
3.911 |
91 |
4.422 |
Exercise 167問題 167
[T]
[T]
- Using a calculator or a computer program, find the best-fit linear function to measure the population.
英語のヒント
電卓またはコンピュータを使い、人口データに最もよく当てはまる1次関数を求めなさい。 - Find the derivative of the equation in a. and explain its physical meaning.(a)で求めた関数の導関数を求め、その具体的な意味を説明しなさい。
- Find the second derivative of the equation and explain its physical meaning.2階導関数を求め、その具体的な意味を説明しなさい。
Solution解き方
a. b. The population is increasing. c. The rate at which the population is increasing is constant.
a. b. 。人口は増加している。 c. 。人口の増加率は一定である。
Exercise 168問題 168
[T]
[T]
- Using a calculator or a computer program, find the best-fit quadratic curve through the data.電卓またはコンピュータを使い、データに最もよく当てはまる2次曲線を求めなさい。
- Find the derivative of the equation and explain its physical meaning.導関数を求め、その具体的な意味を説明しなさい。
- Find the second derivative of the equation and explain its physical meaning.2階導関数を求め、その具体的な意味を説明しなさい。
Exercises 169–170練習問題 169–170
For the following exercises, consider an astronaut on a large planet in another galaxy. To learn more about the composition of this planet, the astronaut drops an electronic sensor into a deep trench. The sensor transmits its vertical position every second in relation to the astronaut’s position. The summary of the falling sensor data is displayed in the following table.
英語のヒント
次の問題では、別の銀河にある大きな惑星で活動する宇宙飛行士を考える。惑星の構成を調べるため、宇宙飛行士は深い溝に電子センサーを落とす。センサーは、宇宙飛行士の位置を基準とした鉛直方向の位置を毎秒送信する。落下中のデータを次の表にまとめた。
Time after dropping (s) 落としてからの時間(秒) |
Position (m) 位置(m) |
|---|---|
0 |
0 |
1 |
−1 |
2 |
−2 |
3 |
−5 |
4 |
−7 |
5 |
−14 |
Exercise 169問題 169
[T]
[T]
- Using a calculator or computer program, find the best-fit quadratic curve to the data.電卓またはコンピュータを使い、データに最もよく当てはまる2次曲線を求めなさい。
- Find the derivative of the position function and explain its physical meaning.位置関数の導関数を求め、その物理的な意味を説明しなさい。
- Find the second derivative of the position function and explain its physical meaning.位置関数の2階導関数を求め、その物理的な意味を説明しなさい。
Solution解き方
a. b. This is the velocity of the sensor. c. This is the acceleration of the sensor; it is a constant acceleration downward.
a. b. 。これはセンサーの速度である。 c. 。これはセンサーの加速度であり、下向きの一定加速度である。
Exercise 170問題 170
[T]
[T]
- Using a calculator or computer program, find the best-fit cubic curve to the data.電卓またはコンピュータを使い、データに最もよく当てはまる3次曲線を求めなさい。
- Find the derivative of the position function and explain its physical meaning.位置関数の導関数を求め、その物理的な意味を説明しなさい。
- Find the second derivative of the position function and explain its physical meaning.位置関数の2階導関数を求め、その物理的な意味を説明しなさい。
- Using the result from c. explain why a cubic function is not a good choice for this problem.(c)の結果を使い、この問題で3次関数が適切な選択ではない理由を説明しなさい。
Exercises 171–174練習問題 171–174
The following problems deal with the Holling type I, II, and III equations. These equations describe the ecological event of growth of a predator population given the amount of prey available for consumption.
英語のヒント
次の問題では、ホリングのI型・II型・III型の式を扱う。これらは、利用可能な餌の量に応じて捕食者の個体数が増えるという、生態学的な現象を記述する。
Exercise 171問題 171
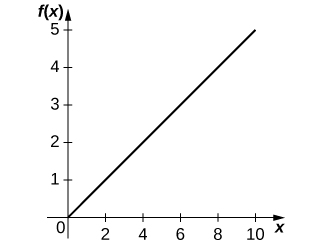
[T] The Holling type I equation is described by where is the amount of prey available and is the rate at which the predator meets the prey for consumption.
[T] ホリングI型の式は、で表される。は利用可能な餌の量、は捕食者が餌と遭遇して食べる割合を表す係数である。
- Graph the Holling type I equation, givenとして、ホリングI型の式のグラフを描きなさい。
- Determine the first derivative of the Holling type I equation and explain physically what the derivative implies.ホリングI型の式の1階導関数を求め、その具体的な意味を説明しなさい。
- Determine the second derivative of the Holling type I equation and explain physically what the derivative implies.ホリングI型の式の2階導関数を求め、その具体的な意味を説明しなさい。
- Using the interpretations from b. and c. explain why the Holling type I equation may not be realistic.(b)と(c)の解釈を使い、ホリングI型の式が現実的とは限らない理由を説明しなさい。
Solution解き方
a.
a.
OpenStax, Rice University; Calculus Volume 1. · CC BY-NC-SA 4.0
b. The more increase in prey, the more growth for predators. c. As the amount of prey increases, the rate at which the predator population growth increases is constant. d. This equation assumes that if there is more prey, the predator is able to increase consumption linearly. This assumption is unphysical because we would expect there to be some saturation point at which there is too much prey for the predator to consume adequately.
英語のヒント
b. 。餌の量が増えるほど、捕食者の増加も大きくなる。c. 。餌の量に対して、捕食者の増加量が増す割合は一定である。d. この式では、餌が増えれば、捕食者はそれに比例して摂食量を増やせると仮定している。しかし実際には、餌が多すぎてそれ以上食べきれない飽和点があると考えられるので、この仮定は現実的ではない。
Exercise 172問題 172
[T] The Holling type II equation is described by where is the amount of prey available and is the maximum consumption rate of the predator.
[T] ホリングII型の式は、で表される。は利用可能な餌の量、は捕食者の最大摂食率である。
- Graph the Holling type II equation given and What are the differences between the Holling type I and II equations?、として、ホリングII型の式のグラフを描きなさい。I型とII型には、どのような違いがあるか。
- Take the first derivative of the Holling type II equation and interpret the physical meaning of the derivative.ホリングII型の式の1階導関数を求め、その具体的な意味を解釈しなさい。
- Show that and interpret the meaning of the parameterを示し、パラメータの意味を解釈しなさい。
- Find and interpret the meaning of the second derivative. What makes the Holling type II function more realistic than the Holling type I function?2階導関数を求め、その意味を解釈しなさい。II型の関数は、どの点でI型より現実的なのか。
Exercise 173問題 173
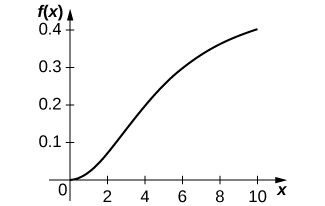
[T] The Holling type III equation is described by where is the amount of prey available and is the maximum consumption rate of the predator.
[T] ホリングIII型の式は、で表される。は利用可能な餌の量、は捕食者の最大摂食率である。
- Graph the Holling type III equation given and What are the differences between the Holling type II and III equations?、として、ホリングIII型の式のグラフを描きなさい。II型とIII型には、どのような違いがあるか。
- Take the first derivative of the Holling type III equation and interpret the physical meaning of the derivative.ホリングIII型の式の1階導関数を求め、その具体的な意味を解釈しなさい。
- Find and interpret the meaning of the second derivative (it may help to graph the second derivative).2階導関数を求め、その意味を解釈しなさい。2階導関数のグラフを描くと考えやすい。
- What additional ecological phenomena does the Holling type III function describe compared with the Holling type II function?III型の関数は、II型に比べて、どのような生態学的な現象をさらに記述できるか。
Solution解き方
a.
a.
OpenStax, Rice University; Calculus Volume 1. · CC BY-NC-SA 4.0
b. When the amount of prey increases, the predator growth increases. c. When the amount of prey is extremely small, the rate at which predator growth is increasing is increasing, but when the amount of prey reaches above a certain threshold, the rate at which predator growth is increasing begins to decrease. d. At lower levels of prey, the prey is more easily able to avoid detection by the predator, so fewer prey individuals are consumed, resulting in less predator growth.
英語のヒント
b. 。餌が増えると、捕食者の増加量も増える。c. 。餌がごく少ない段階では、餌の増加に対する捕食者の増加量の伸びが大きくなっていく。しかし餌があるしきい値を超えると、その伸びは小さくなり始める。d. 餌となる個体が少ないときには、捕食者に見つからずに済みやすい。そのため食べられる個体が少なく、捕食者の増加も小さい。
Exercise 174問題 174
[T] The populations of the snowshoe hare (in thousands) and the lynx (in hundreds) collected over 7 years from 1937 to 1943 are shown in the following table. The snowshoe hare is the primary prey of the lynx.
[T] 次の表は、1937年から1943年までの7年間に調べたカンジキウサギの個体数(千匹単位)とオオヤマネコの個体数(百匹単位)である。カンジキウサギは、オオヤマネコの主な獲物である。
Population of snowshoe hare (thousands) カンジキウサギの個体数(千匹) |
Population of lynx (hundreds) オオヤマネコの個体数(百匹) |
|---|---|
20 |
10 |
55 |
15 |
65 |
55 |
95 |
60 |
- Graph the data points and determine which Holling-type function fits the data best.データをプロットし、どのホリング型の関数が最もよく当てはまるかを判断しなさい。
- Using the meanings of the parameters and determine values for those parameters by examining a graph of the data. Recall that measures what prey value results in the half-maximum of the predator value.パラメータとの意味を使い、データのグラフから値を決めなさい。は、捕食者側の値が最大値の半分になるときの餌の量を表すことを思い出そう。
- Plot the resulting Holling-type I, II, and III functions on top of the data. Was the result from part a. correct?求めたホリングI型・II型・III型の関数を、データに重ねて描きなさい。(a)での判断は正しかったか。
acceleration
加速度
is the rate of change of the velocity, that is, the derivative of velocity
速度の変化率、すなわち速度の導関数。
amount of change
変化量
the amount of a function over an interval is
区間における関数の変化量は、である。
average rate of change
平均変化率
is a function over an interval is
区間における関数の平均変化率は、である。
marginal cost
限界費用
is the derivative of the cost function, or the approximate cost of producing one more item
費用関数の導関数。さらに1個生産するための費用を近似する。
marginal revenue
限界収入
is the derivative of the revenue function, or the approximate revenue obtained by selling one more item
収入関数の導関数。さらに1個販売したときの収入の増加分を近似する。
marginal profit
限界利益
is the derivative of the profit function, or the approximate profit obtained by producing and selling one more item
利益関数の導関数。さらに1個生産・販売したときの利益の増加分を近似する。
population growth rate
個体数・人口の増加率
is the derivative of the population with respect to time
個体数や人口を、時間について微分したもの。
speed
速さ
is the absolute value of velocity, that is, is the speed of an object at time whose velocity is given by
速度の絶対値。速度がの物体について、時刻における速さはである。