第12章線形回帰と相関
UNDERSTANDING SLOPE傾きを理解する
The slope of the line, b, describes how changes in the variables are related. It is important to interpret the slope of the line in the context of the situation represented by the data. You should be able to write a sentence interpreting the slope in plain English.
直線の傾きbは、変数の変化どうしがどのように関係するかを表す。データが示す状況に即して傾きを解釈することが重要である。傾きの意味を平易な言葉で説明する文を書けるようにしよう。
INTERPRETATION OF THE SLOPE: The slope of the best-fit line tells us how the dependent variable (y) changes for every one unit increase in the independent (x) variable, on average.
傾きの解釈:最適な当てはめ直線の傾きは、独立変数xが1単位増えるごとに、従属変数yが平均してどのように変化するかを示す。
THIRD EXAM vs FINAL EXAM EXAMPLE第3回試験と期末試験の例
Slope: The slope of the line is b = 4.83.
Interpretation: For a one-point increase in the score on the third exam, the final exam score increases by 4.83 points, on average.
Interpretation: For a one-point increase in the score on the third exam, the final exam score increases by 4.83 points, on average.
傾き:直線の傾きはb = 4.83である。解釈:第3回試験の得点が1点増えると、期末試験の得点は平均して4.83点増える。
Using the Calculator電卓の操作
The Correlation Coefficient r相関係数r
Besides looking at the scatter plot and seeing that a line seems reasonable, how can you tell if the line is a good predictor? Use the correlation coefficient as another indicator (besides the scatterplot) of the strength of the relationship between x and y.
英語のヒント
散布図を見て直線が妥当そうだと分かることに加え、その直線が予測に適しているかをどう判断できるだろうか。xとyの関係の強さを示す、散布図以外の指標として相関係数を使おう。
The correlation coefficient, r, developed by Karl Pearson in the early 1900s, is numerical and provides a measure of strength and direction of the linear association between the independent variable x and the dependent variable y.
相関係数rは、1900年代初めにカール・ピアソンが考案した数値であり、独立変数xと従属変数yの線形の関連の強さと方向を測る。
The correlation coefficient is calculated as
相関係数は次のように計算する。
where n = the number of data points.
ここで、nはデータ点の数である。
If you suspect a linear relationship between x and y, then r can measure how strong the linear relationship is.
xとyに線形関係があると考えられるなら、rによってその強さを測れる。
What the VALUE of r tells us:rの値が示すこと
- The value of r is always between –1 and +1: –1 ≤ r ≤ 1.rの値は常に−1から+1の間にある:−1 ≤ r ≤ 1。
- The size of the correlation r indicates the strength of the linear relationship between x and y. Values of r close to –1 or to +1 indicate a stronger linear relationship between x and y.相関係数rの大きさは、xとyの線形関係の強さを示す。rが−1または+1に近いほど、線形関係が強いことを示す。
- If r = 0 there is likely no linear correlation. It is important to view the scatterplot, however, because data that exhibit a curved or horizontal pattern may have a correlation of 0.r = 0なら、線形相関はない可能性が高い。ただし、曲線状または水平のパターンを示すデータでも相関が0になることがあるため、散布図を確認することが重要である。
- If r = 1, there is perfect positive correlation. If r = –1, there is perfect negative correlation. In both these cases, all of the original data points lie on a straight line. Of course,in the real world, this will not generally happen.r = 1なら完全な正の相関があり、r = −1なら完全な負の相関がある。どちらの場合も、元のデータ点はすべて一直線上にある。もちろん、現実には一般にこのようにはならない。
What the SIGN of r tells usrの符号が示すこと
- A positive value of r means that when x increases, y tends to increase and when x decreases, y tends to decrease (positive correlation).rが正であるとは、xが増えるとyも増える傾向があり、xが減るとyも減る傾向があるということである(正の相関)。
- A negative value of r means that when x increases, y tends to decrease and when x decreases, y tends to increase (negative correlation).rが負であるとは、xが増えるとyが減る傾向があり、xが減るとyが増える傾向があるということである(負の相関)。
- The sign of r is the same as the sign of the slope, b, of the best-fit line.rの符号は、最適な当てはめ直線の傾きbの符号と同じである。
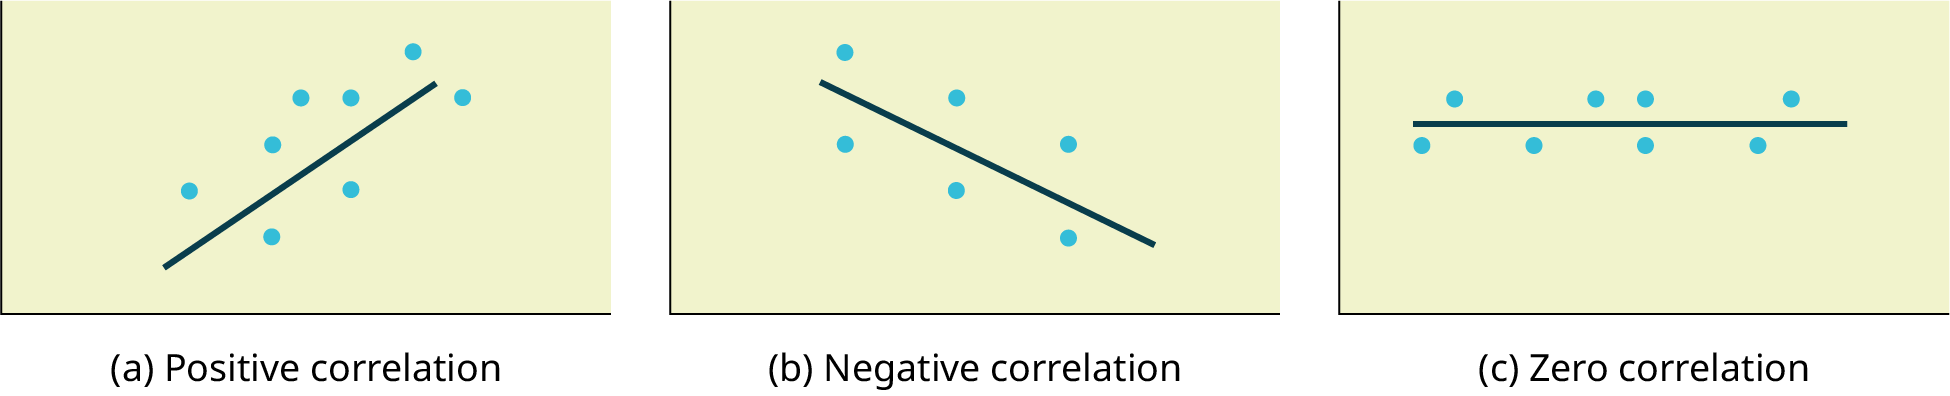

Figure 12.21図 12.21
(a) A scatter plot showing data with a positive correlation. 0 < r < 1 (b) A scatter plot showing data with a negative correlation. –1 < r < 0 (c) A scatter plot showing data with zero correlation. r = 0
(a)正の相関を示す散布図。0 < r < 1。(b)負の相関を示す散布図。−1 < r < 0。(c)相関が0の散布図。r = 0。
The formula for r looks formidable. However, computer spreadsheets, statistical software, and many calculators can quickly calculate r. The correlation coefficient r is the bottom item in the output screens for the LinRegTTest on the TI-83, TI-83+, or TI-84+ calculator (see previous section for instructions).
英語のヒント
rの式は難しそうに見える。しかし、表計算ソフト、統計ソフト、多くの電卓でrを素早く計算できる。TI-83、TI-83+、TI-84+電卓では、相関係数rはLinRegTTestの出力画面の一番下に表示される(手順は前の節を参照)。