第12章線形回帰と相関
12.2 Scatter Plots12.2 散布図
Before we take up the discussion of linear regression and correlation, we need to examine a way to display the relation between two variables x and y. The most common and easiest way is a scatter plot. The following example illustrates a scatter plot.
英語のヒント
線形回帰と相関を論じる前に、二つの変数xとyの関係を表示する方法を調べる必要がある。最も一般的で簡単な方法は散布図である。次の例で散布図を示す。
Example 12.5例題 12.5
An educational researcher collects data on the vocabulary size of children as a function of age. The data is shown in Table 12.1. Is there a relationship between age and vocabulary size for young children? Construct a scatter plot. Let x = Child’s Age, and let y = Vocabulary Size.
英語のヒント
教育研究者が、子どもの語彙数を年齢の関数として調べるデータを収集している。データを表12.1に示す。幼い子どもの年齢と語彙数には関係があるだろうか。散布図を作ろう。xを子どもの年齢、yを語彙数とする。
Age (years) 年齢(歳) |
Vocabulary Size (number of words) 語彙数(単語数) |
|---|---|
3 |
655 |
4 |
1098 |
6 |
2463 |
7 |
3195 |
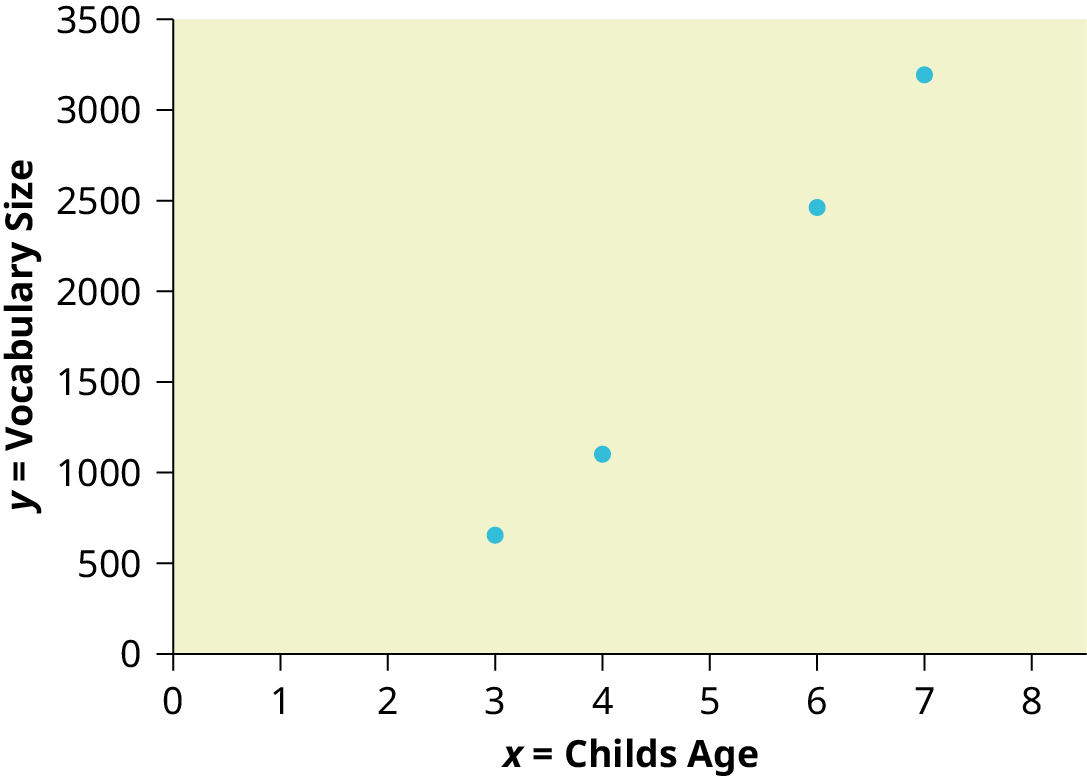
Figure 12.8図 12.8
Using the Calculator電卓の操作
A scatter plot shows the direction of a relationship between the variables. A clear direction happens when there is either:
散布図は変数間の関係の方向を示す。次のいずれかの場合、明確な方向が現れる。
- High values of one variable occurring with high values of the other variable or low values of one variable occurring with low values of the other variable.一方の変数が大きいとき他方も大きく、一方が小さいとき他方も小さい。
- High values of one variable occurring with low values of the other variable.一方の変数が大きいとき他方は小さい。
You can determine the strength of the relationship by looking at the scatter plot and seeing how close the points are to a line, a power function, an exponential function, or to some other type of function. For a linear relationship there is an exception. Consider a scatter plot where all the points fall on a horizontal line providing a "perfect fit." The horizontal line would in fact show no relationship.
英語のヒント
散布図の点が、直線、べき関数、指数関数、その他の種類の関数にどれほど近いかを見ることで、関係の強さを判断できる。線形関係には例外がある。すべての点が水平な直線上にあり、「完全に適合」する散布図を考えよう。実際には、その水平線は関係がないことを示す。
When you look at a scatterplot, you want to notice the overall pattern and any deviations from the pattern. The following scatterplot examples illustrate these concepts.
英語のヒント
散布図を見るときは、全体のパターンと、そこから外れる点に注目したい。次の散布図の例で、これらの考え方を示す。
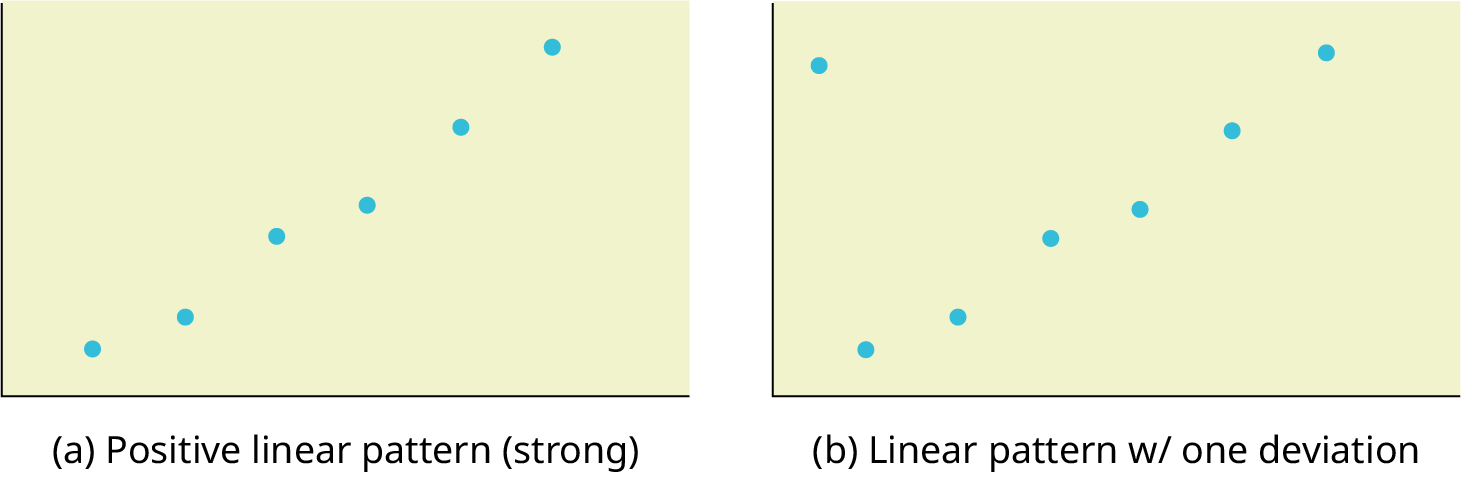
Figure 12.9図 12.9
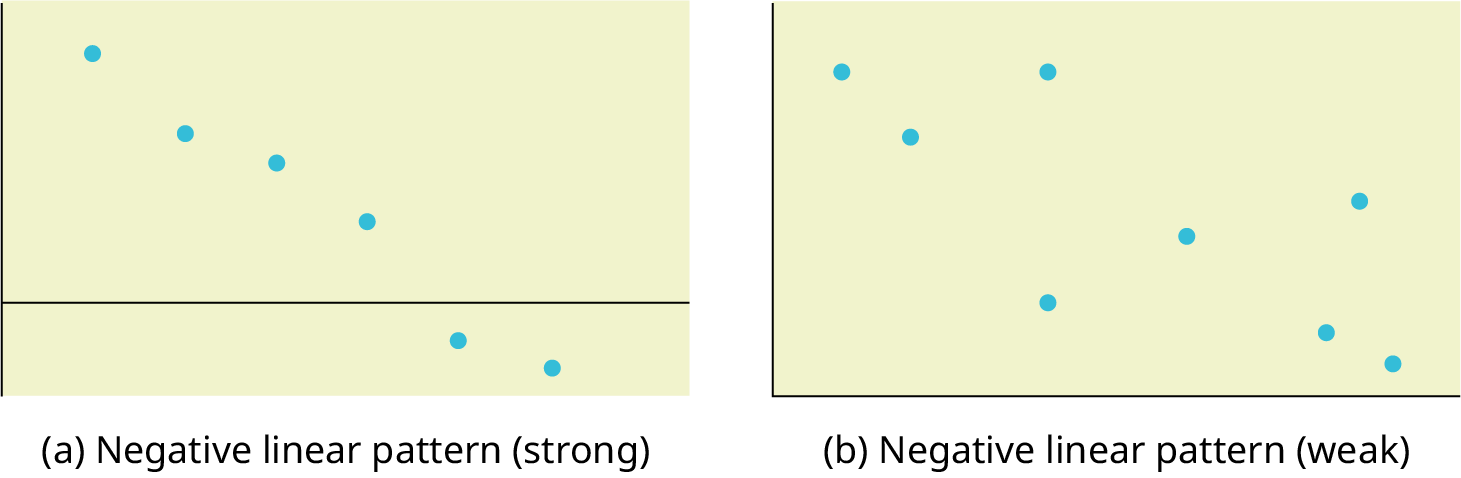
Figure 12.10図 12.10
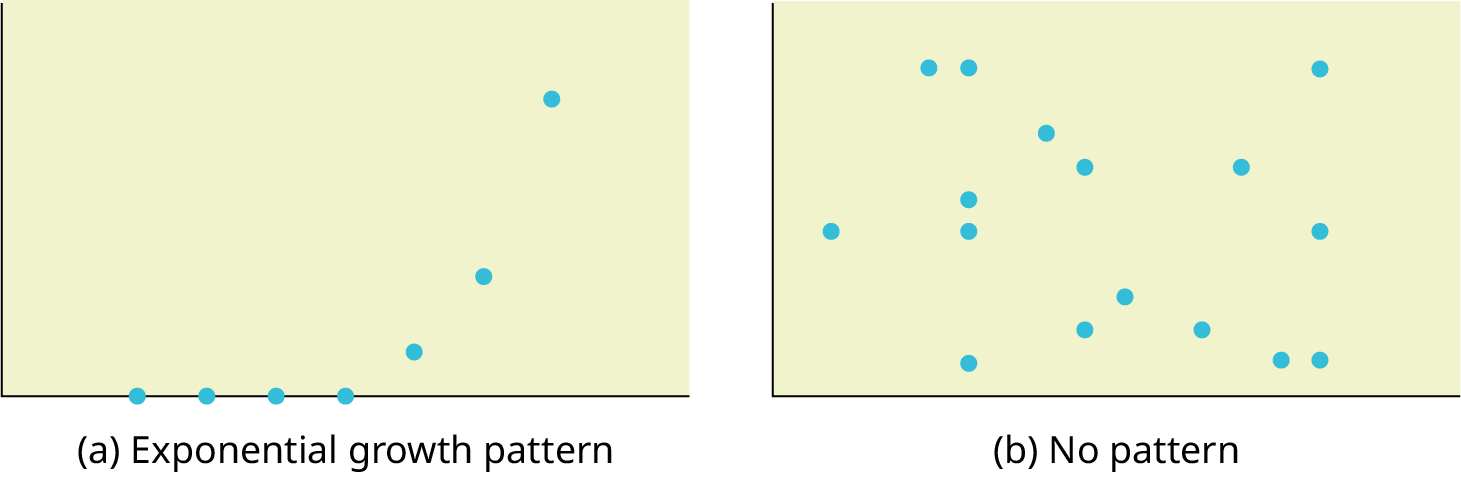
Figure 12.11図 12.11
In this chapter, we are interested in scatter plots that show a linear pattern. Linear patterns are quite common. The linear relationship is strong if the points are close to a straight line, except in the case of a horizontal line where there is no relationship. If we think that the points show a linear relationship, we would like to draw a line on the scatter plot. This line can be calculated through a process called linear regression. However, we only calculate a regression line if one of the variables helps to explain or predict the other variable. If x is the independent variable and y the dependent variable, then we can use a regression line to predict y for a given value of x
英語のヒント
この章では、直線的なパターンを示す散布図に関心を持つ。直線的なパターンはよく現れる。点が直線の近くに並んでいれば線形関係は強い。ただし、関係がない水平線の場合は除く。点が線形関係を示すと考えたら、散布図に直線を引きたい。この直線は線形回帰という手順で計算できる。ただし、回帰直線を計算するのは、一方の変数が他方を説明または予測するのに役立つ場合だけである。xが独立変数、yが従属変数なら、与えられたxの値から回帰直線を使ってyを予測できる。
Chapter Review章の復習
Scatter plots are particularly helpful graphs when we want to see if there is a linear relationship among data points. They indicate both the direction of the relationship between the x variables and the y variables, and the strength of the relationship. We calculate the strength of the relationship between an independent variable and a dependent variable using linear regression.
散布図は、データの点の間に線形関係があるかを調べるとき、とりわけ役立つグラフである。xとyの変数間の関係の方向と、その強さの両方を示す。独立変数と従属変数の関係の強さは、線形回帰を使って計算する。
Exercises 19–21練習問題 19–21
Exercise 19問題 19
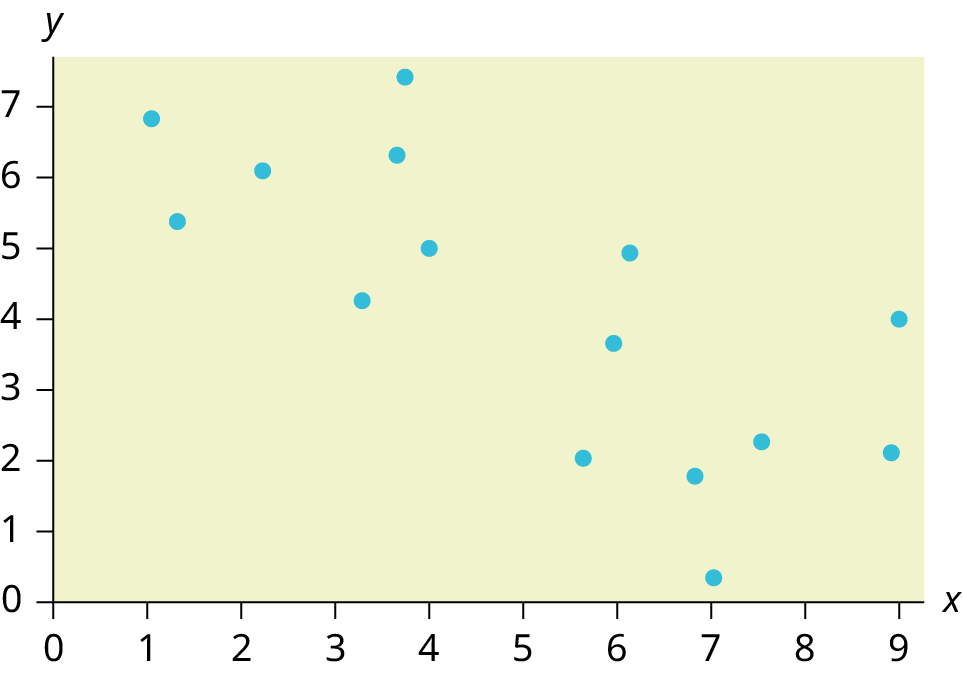
Does the scatter plot appear linear? Strong or weak? Positive or negative?
散布図は直線的に見えるか。関係は強いか弱いか。正か負か。
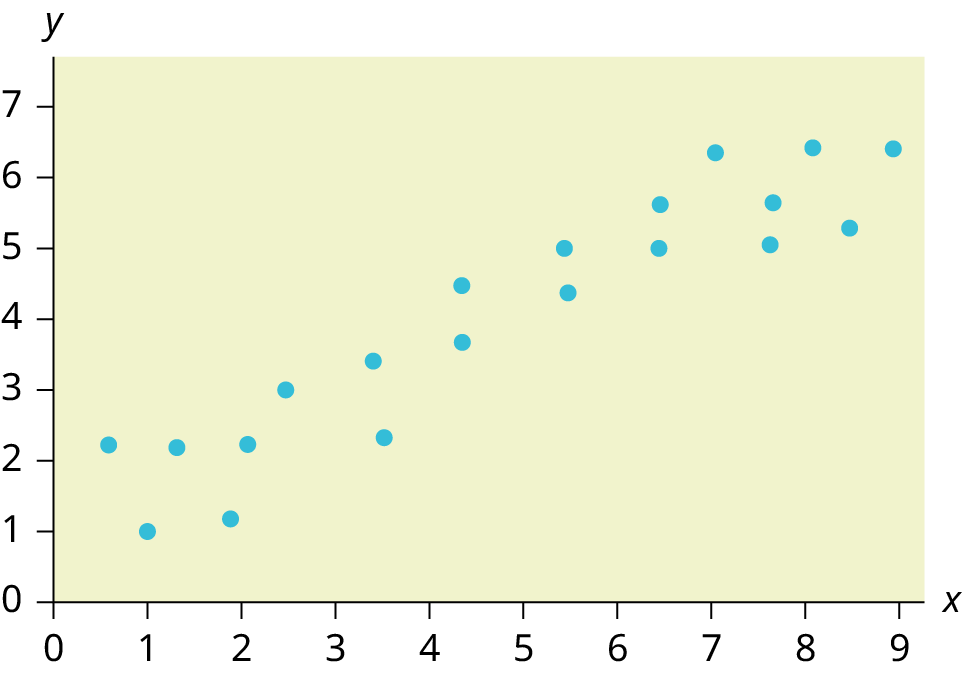
Figure 12.12図 12.12
Solution解き方
The data appear to be linear with a strong, positive correlation.
データは直線的で、強い正の相関があるように見える。
Exercise 20問題 20
Exercise 21問題 21
Does the scatter plot appear linear? Strong or weak? Positive or negative?
散布図は直線的に見えるか。関係は強いか弱いか。正か負か。
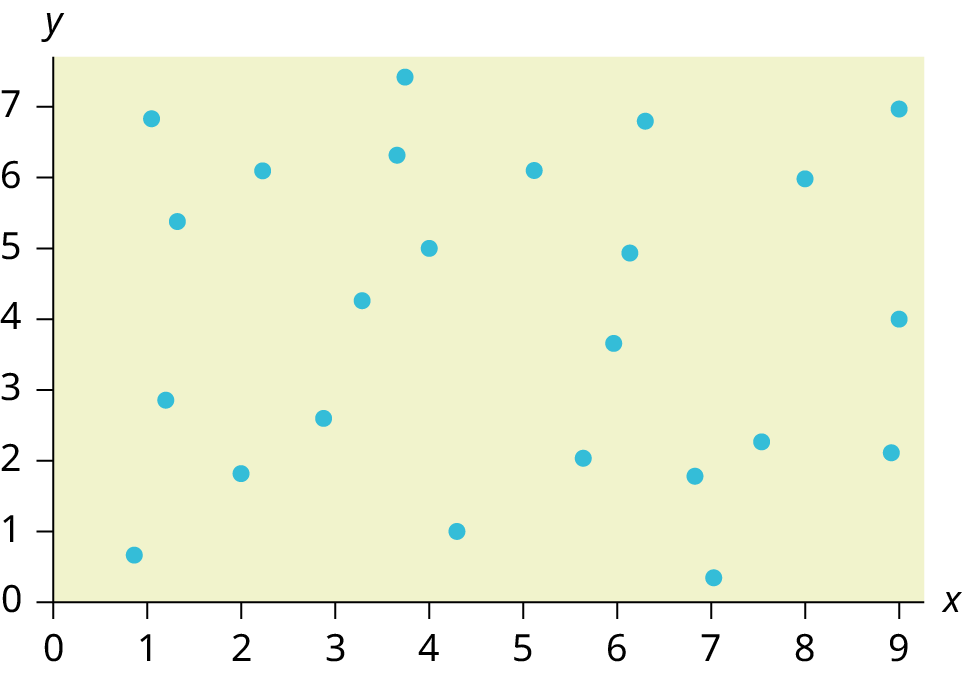


Figure 12.14図 12.14
Solution解き方
The data appear to have no correlation.
データには相関がないように見える。